ms. walker, the physics teacher, wears a watch that counts her steps. today, while her first - period class…
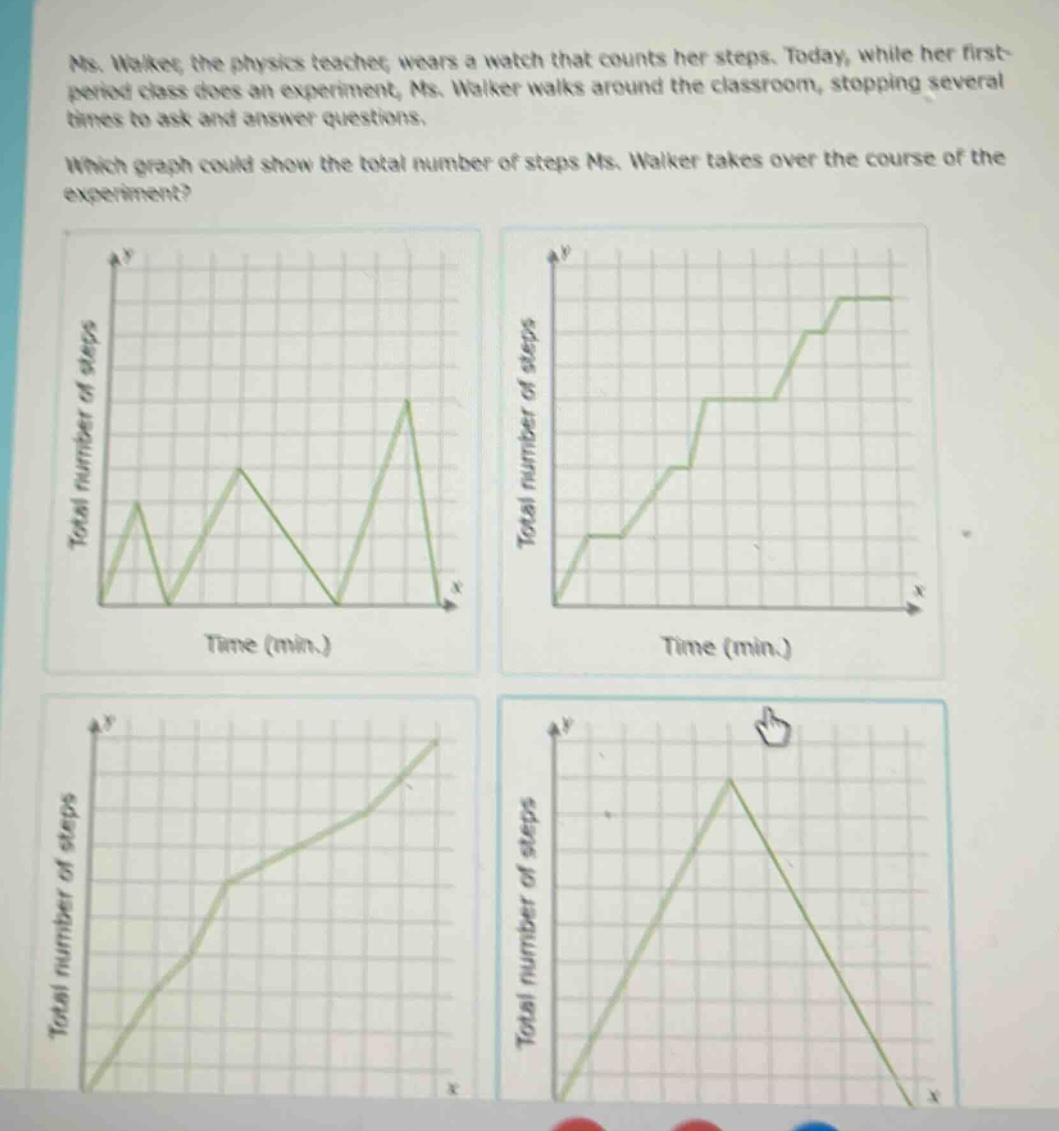
ms. walker, the physics teacher, wears a watch that counts her steps. today, while her first - period class does an experiment, ms. walker walks around the classroom, stopping several times to ask and answer questions. which graph could show the total number of steps ms. walker takes over the course of the experiment?
Answer
Explanation:
Step1: Analyze walking and stopping
When Ms. Walker walks, the number of steps increases. When she stops to ask and answer questions, the number of steps remains the same.
Step2: Examine graph - characteristics
The graph should have increasing - parts (when walking) and horizontal - parts (when stopping).
Step3: Evaluate options
The first graph has decreasing parts which is not possible for total steps. The third graph has no horizontal parts indicating no stops. The fourth graph has a decreasing part for total steps which is incorrect. The second graph has increasing parts when she walks and horizontal parts when she stops.