one spring day, bilquis noted the time of day and the temperature, in degrees fahrenheit. her findings are…
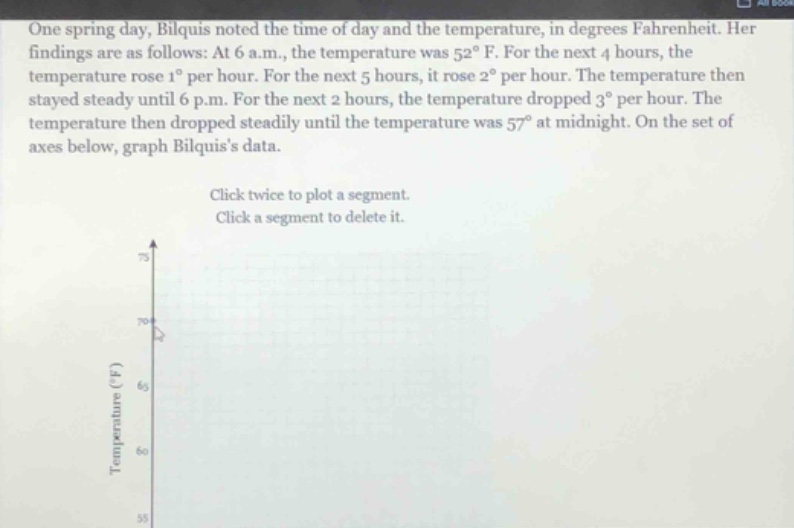
one spring day, bilquis noted the time of day and the temperature, in degrees fahrenheit. her findings are as follows: at 6 a.m., the temperature was 52°f. for the next 4 hours, the temperature rose 1° per hour. for the next 5 hours, it rose 2° per hour. the temperature then stayed steady until 6 p.m. for the next 2 hours, the temperature dropped 3° per hour. the temperature then dropped steadily until the temperature was 57° at midnight. on the set of axes below, graph bilquiss data. click twice to plot a segment. click a segment to delete it.
Answer
Explanation:
Step1: Calculate temperature from 6 a.m. - 10 a.m.
Initial temp at 6 a.m. is 52°F. It rises 1°F per hour for 4 hours. So at 10 a.m., $T_1=52 + 1\times4=56^{\circ}F$.
Step2: Calculate temperature from 10 a.m. - 3 p.m.
From 10 a.m. to 3 p.m. (5 - hour period), it rises 2°F per hour. Starting from 56°F, at 3 p.m., $T_2=56+2\times5 = 66^{\circ}F$.
Step3: Temperature from 3 p.m. - 6 p.m.
It stays steady at 66°F from 3 p.m. - 6 p.m.
Step4: Calculate temperature from 6 p.m. - 8 p.m.
It drops 3°F per hour for 2 hours. So at 8 p.m., $T_3=66-3\times2 = 60^{\circ}F$.
Step5: Calculate temperature change from 8 p.m. - midnight
From 8 p.m. to midnight (4 - hour period), the temperature goes from 60°F to 57°F. The rate of change is $\frac{60 - 57}{4}=0.75^{\circ}F$ per hour.
To graph:
- Plot the point (6, 52).
- Draw a line with a slope of 1 from (6, 52) to (10, 56).
- Draw a line with a slope of 2 from (10, 56) to (15, 66).
- Draw a horizontal line from (15, 66) to (18, 66).
- Draw a line with a slope of - 3 from (18, 66) to (20, 60).
- Draw a line with a slope of - 0.75 from (20, 60) to (24, 57).
Answer:
Graph as described above with points and line - segments representing the temperature changes over time.