one spring day, yusuf noted the time of day and the temperature, in degrees fahrenheit. during that time…
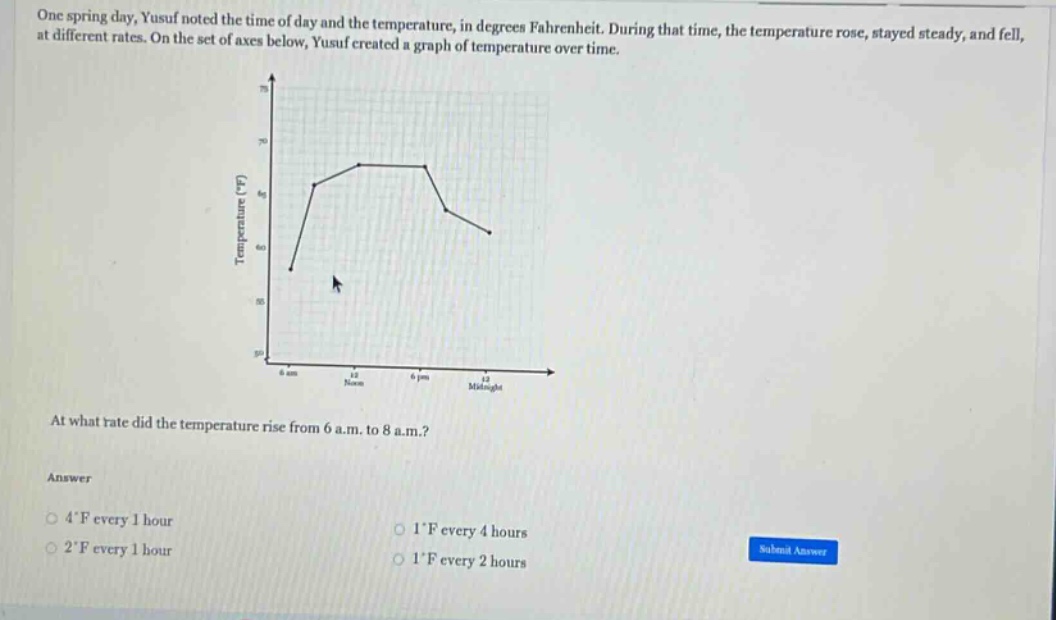
one spring day, yusuf noted the time of day and the temperature, in degrees fahrenheit. during that time, the temperature rose, stayed steady, and fell, at different rates. on the set of axes below, yusuf created a graph of temperature over time. at what rate did the temperature rise from 6 a.m. to 8 a.m.? answer 4°f every 1 hour 1°f every 4 hours 2°f every 1 hour 1°f every 2 hours
Answer
Explanation:
Step1: Identify time - interval
The time interval from 6 a.m. to 8 a.m. is $8 - 6=2$ hours.
Step2: Identify temperature change
From the graph, at 6 a.m. the temperature is around 40°F and at 8 a.m. it is around 44°F. The temperature change is $44 - 40 = 4$°F.
Step3: Calculate rate of change
The rate of change of temperature is $\frac{\text{Change in temperature}}{\text{Change in time}}=\frac{4}{2}=2$°F per hour.
Answer:
2°F every 1 hour