after performing the experiment on each open container, the student analyzes the data shown in the graph…
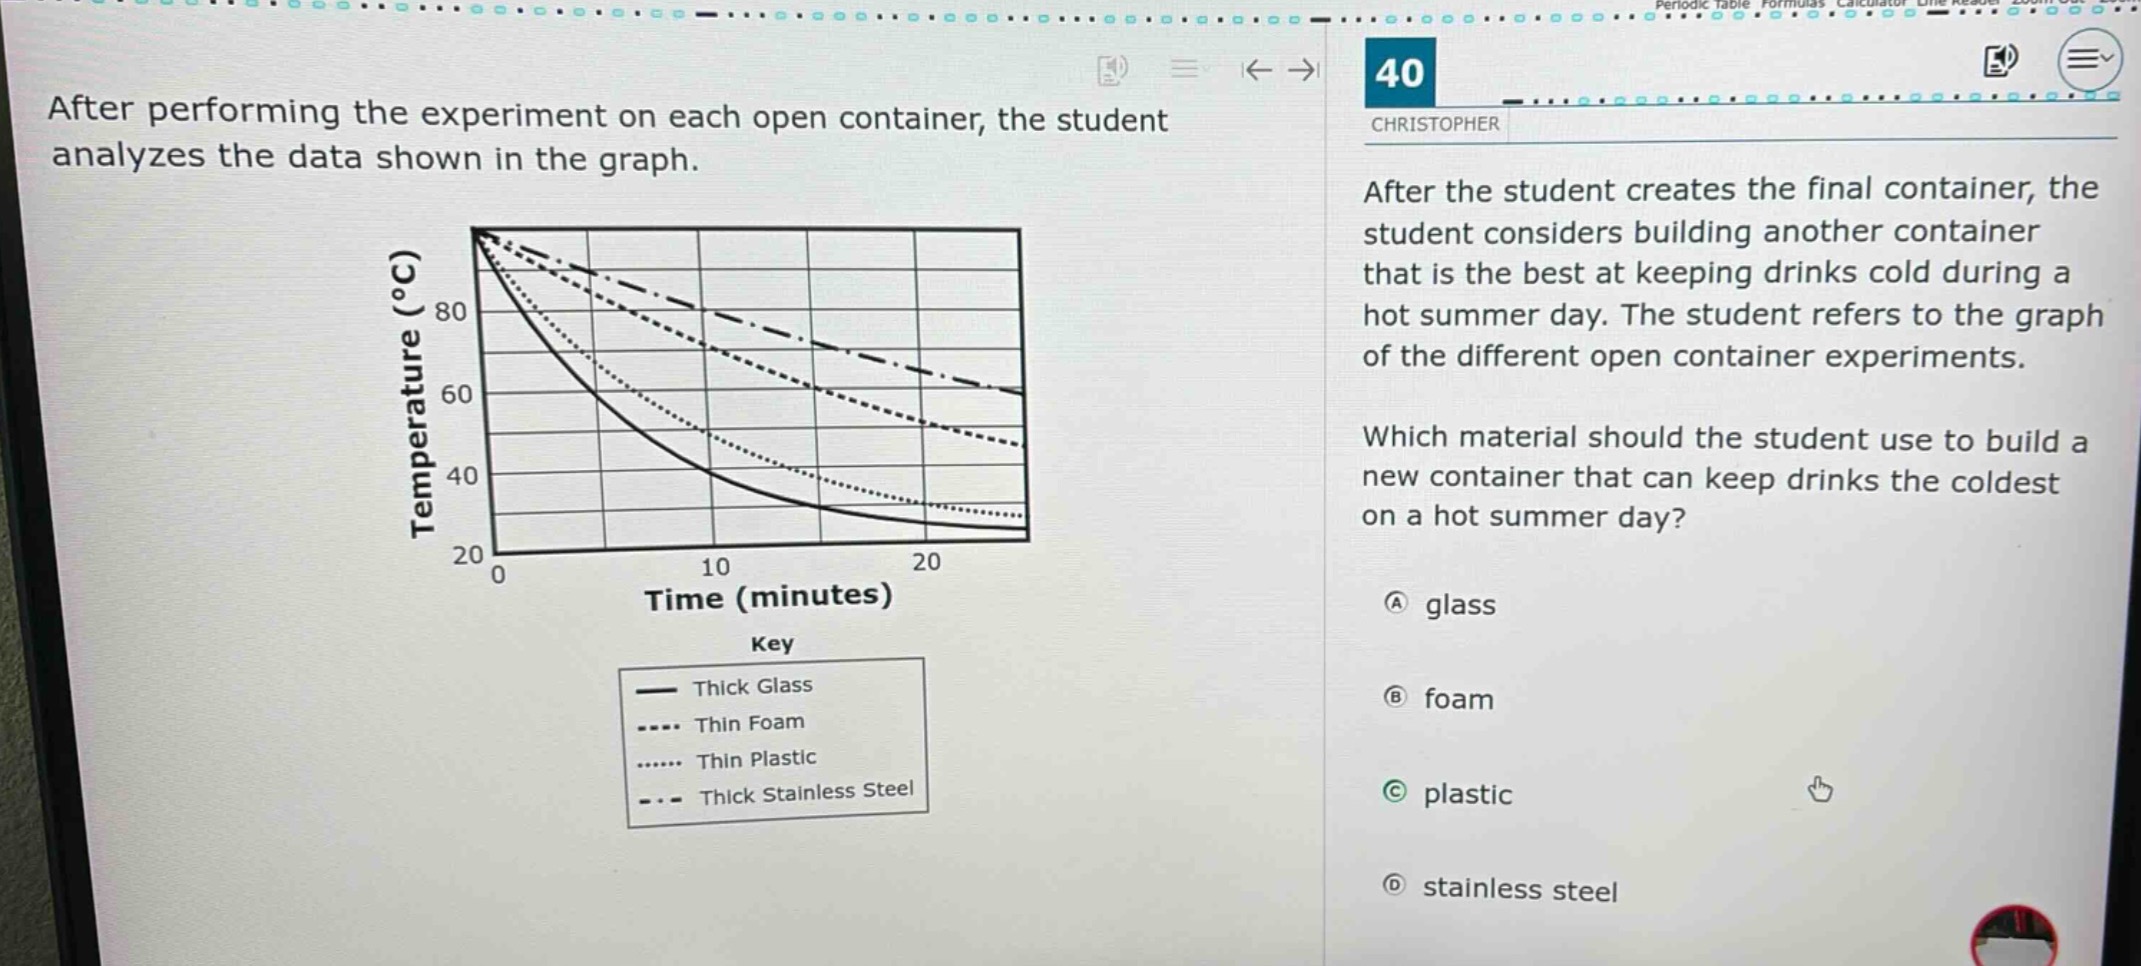
after performing the experiment on each open container, the student analyzes the data shown in the graph. after the student creates the final container, the student considers building another container that is the best at keeping drinks cold during a hot summer day. the student refers to the graph of the different open - container experiments. which material should the student use to build a new container that can keep drinks the coldest on a hot summer day? a glass b foam c plastic d stainless steel
Answer
Brief Explanations:
Insulate - better materials keep drinks cold longer. From the graph, foam has the slowest - temperature - increase rate, meaning it is a good insulator.
Answer:
B. foam