which phase change is most likely taking place in this graph?\n a gas to a liquid\n a liquid to a solid\n a…
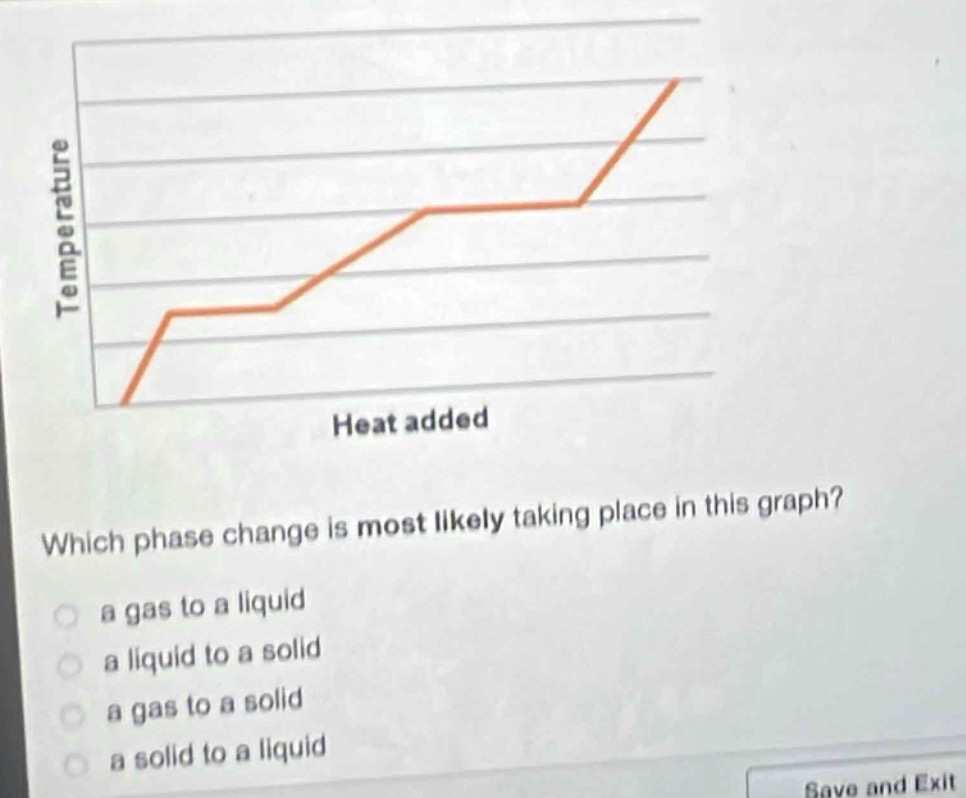
which phase change is most likely taking place in this graph?\n a gas to a liquid\n a liquid to a solid\n a gas to a solid\n a solid to a liquid
Answer
Brief Explanations:
When heat is added during a phase - change from solid to liquid (melting), the temperature remains constant during the phase - change process. In the graph, there are horizontal segments where heat is added but temperature doesn't change, which is characteristic of a phase - change. The overall trend of increasing temperature with heat addition before and after the horizontal segments indicates a solid - to - liquid phase change.
Answer:
a solid to a liquid