the pressure on a sample of pure x held at - 160. °c and 1.23 atm is decreased until the sample melts. the…
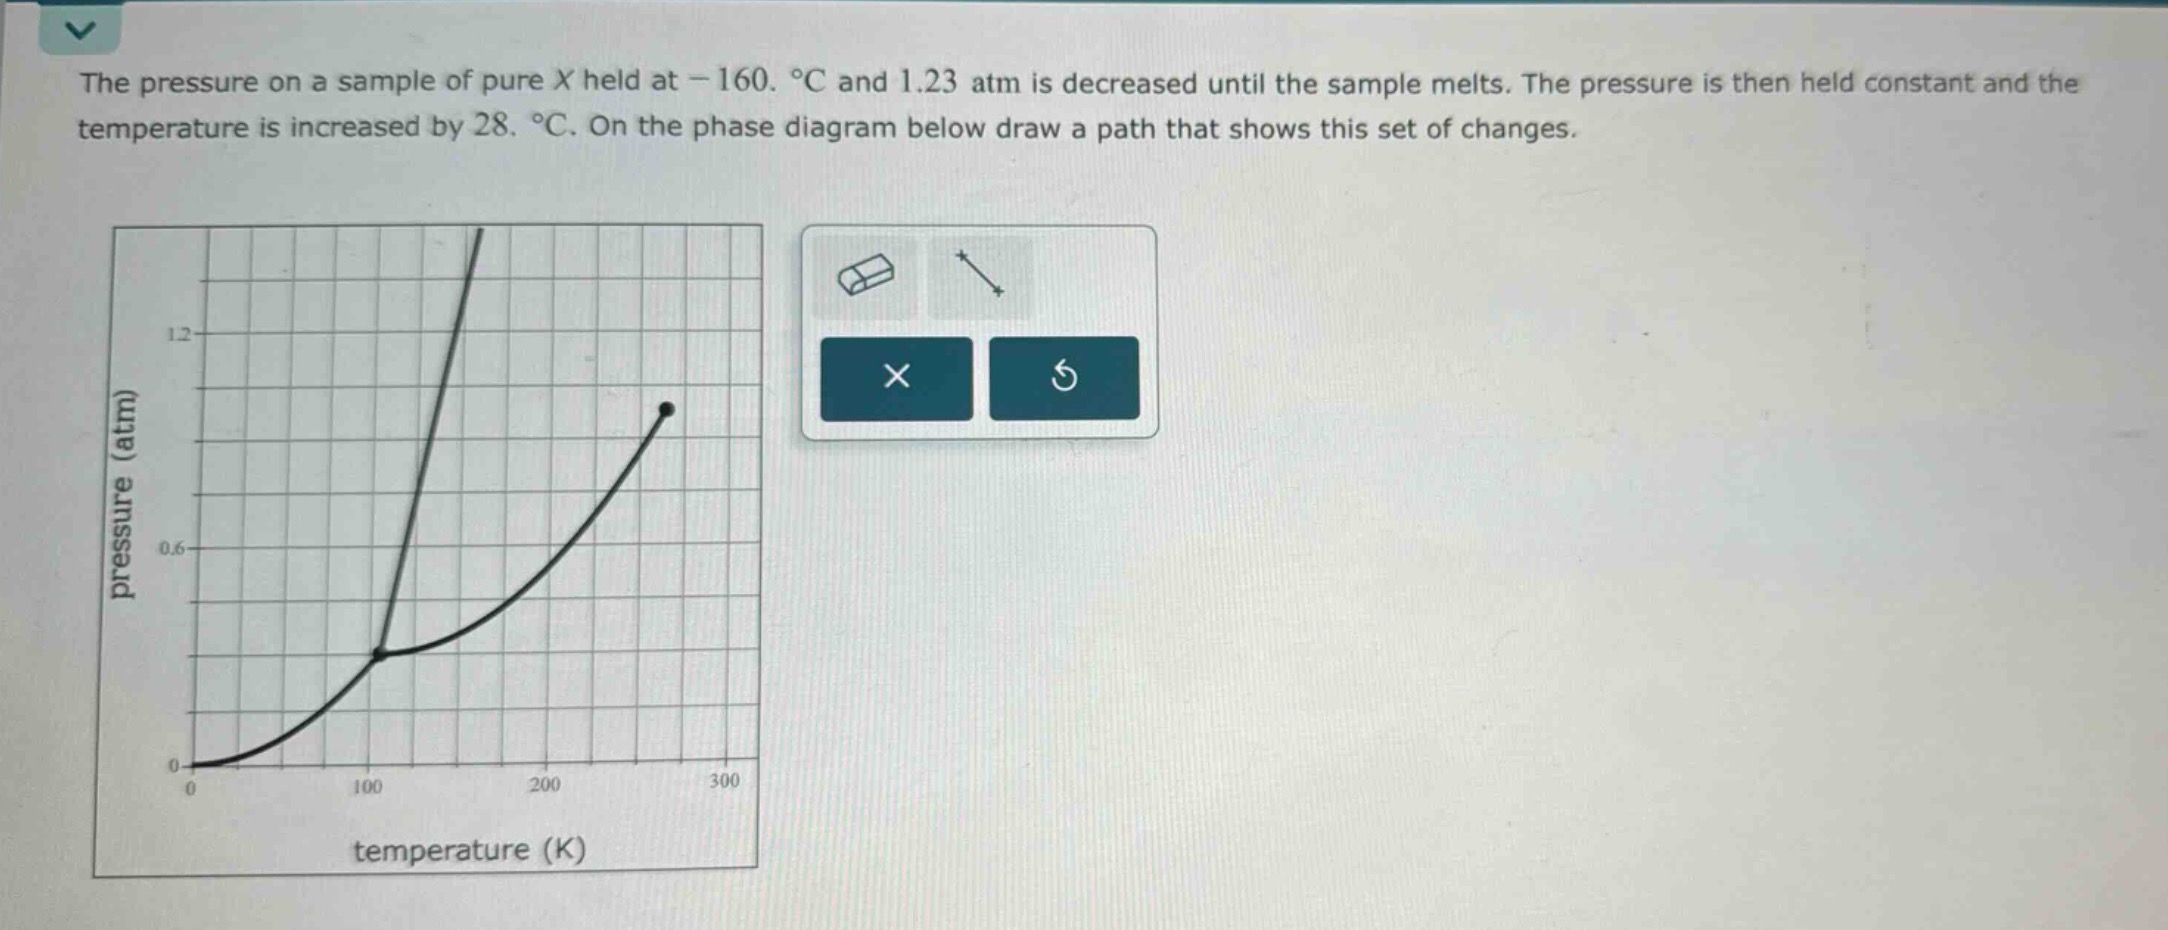
the pressure on a sample of pure x held at - 160. °c and 1.23 atm is decreased until the sample melts. the pressure is then held constant and the temperature is increased by 28. °c. on the phase diagram below draw a path that shows this set of changes.
Answer
Explanation:
Step1: Calculate initial temperature in Kelvin and locate point A.
The initial temperature is $T = -160 \text{ }^\circ\text{C}$ and pressure $P = 1.23 \text{ atm}$. Convert temperature to Kelvin: $T_A = -160 + 273.15 = 113.15 \text{ K}$. So, the initial point A is $(113.15 \text{ K}, 1.23 \text{ atm})$. On the phase diagram, this point is in the solid phase.
Step2: Determine point B after isothermal pressure decrease until melting.
The temperature is held constant at $T_B = 113.15 \text{ K}$. The pressure is decreased until the sample melts, meaning it reaches the solid-liquid phase boundary. By visual inspection of the provided phase diagram, at $T = 113.15 \text{ K}$ (slightly to the right of the 100 K mark, and to the right of the triple point temperature which is approx. 110 K), the solid-liquid boundary (melting line) is at a pressure $P_B \approx 0.32 \text{ atm}$. So, point B is $(113.15 \text{ K}, \approx 0.32 \text{ atm})$. The path from A to B is a vertical line segment downwards. At point B, the substance is transitioning from solid to liquid.
Step3: Determine point C after isobaric temperature increase.
The pressure is held constant at $P_C = P_B \approx 0.32 \text{ atm}$. The temperature is increased by $28 \text{ }^\circ\text{C}$, which is an increase of $28 \text{ K}$. The new temperature is $T_C = T_B + 28 \text{ K} = 113.15 \text{ K} + 28 \text{ K} = 141.15 \text{ K}$. So, point C is $(141.15 \text{ K}, \approx 0.32 \text{ atm})$. The path from B to C is a horizontal line segment to the right. At point C $(141.15 \text{ K}, \approx 0.32 \text{ atm})$, the substance is in the liquid phase (to the right of the solid-liquid boundary and above the liquid-gas boundary).
Answer:
The path should be drawn on the phase diagram as follows:
- Start at point A, located at approximately $T = 113.15 \text{ K}$ (about two-thirds of the way between the 100 K and 120 K grid lines) and $P = 1.23 \text{ atm}$ (just above the 1.2 atm grid line).
- Draw a vertical line segment downwards from point A to point B. Point B is on the solid-liquid phase boundary, at $T = 113.15 \text{ K}$ and $P \approx 0.32 \text{ atm}$ (slightly above the 0.3 atm level, which is midway between the 0.2 atm and 0.4 atm grid lines).
- From point B, draw a horizontal line segment to the right to point C. Point C is at $P \approx 0.32 \text{ atm}$ and $T = 141.15 \text{ K}$ (very slightly to the right of the 140 K grid line). The path consists of these two connected line segments: A $\rightarrow$ B (vertical) and B $\rightarrow$ C (horizontal).