its race day for ninas rowing team! when the race starts, the team accelerates until they hit their target…
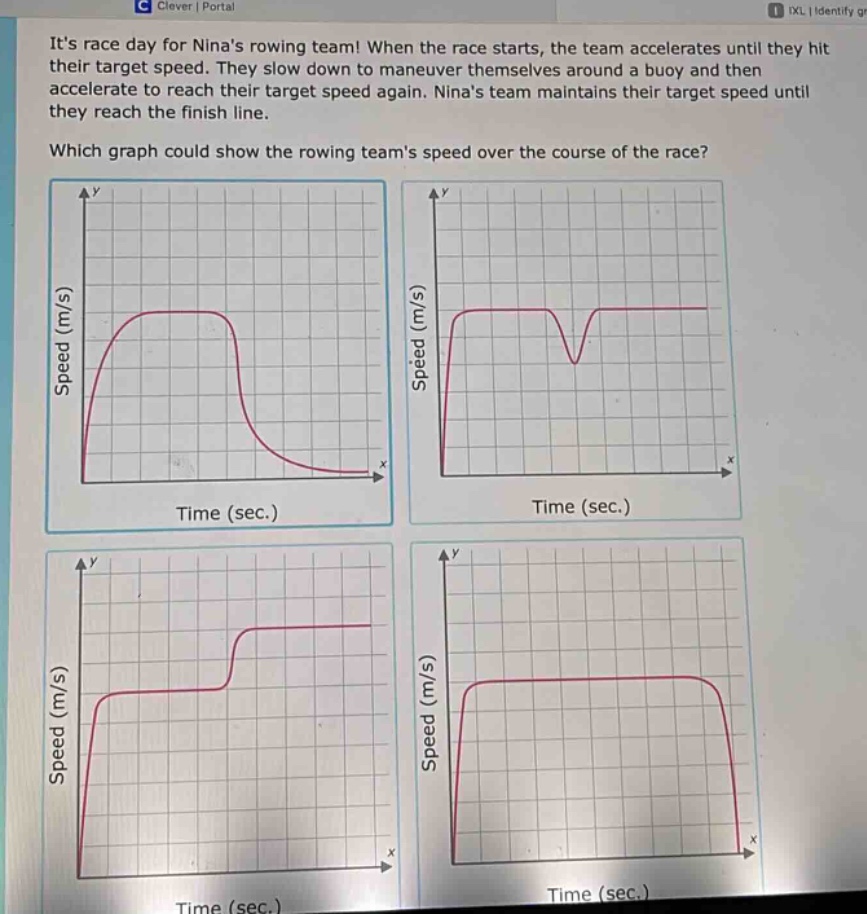
its race day for ninas rowing team! when the race starts, the team accelerates until they hit their target speed. they slow down to maneuver themselves around a buoy and then accelerate to reach their target speed again. ninas team maintains their target speed until they reach the finish line. which graph could show the rowing teams speed over the course of the race? speed (m/s) time (sec.) speed (m/s) time (sec.) speed (m/s) time (sec.) speed (m/s) time (sec.)
Answer
Answer:
The second - graph (top - right graph)
Explanation:
Step1: Analyze start of race
At the start, the team accelerates, so speed increases from 0 to target speed. This is shown by an upward - sloping curve at the start of the graph.
Step2: Analyze maneuver around buoy
They slow down to maneuver around the buoy, so there is a downward - sloping part in the graph.
Step3: Analyze post - buoy acceleration
Then they accelerate again to reach the target speed, shown by an upward - sloping curve.
Step4: Analyze end of race
They maintain the target speed until the finish line, shown by a horizontal line. The second graph (top - right) satisfies all these conditions.