the rate of collection by a solar panel decreased steadily throughout the day due to increasing cloud cover…
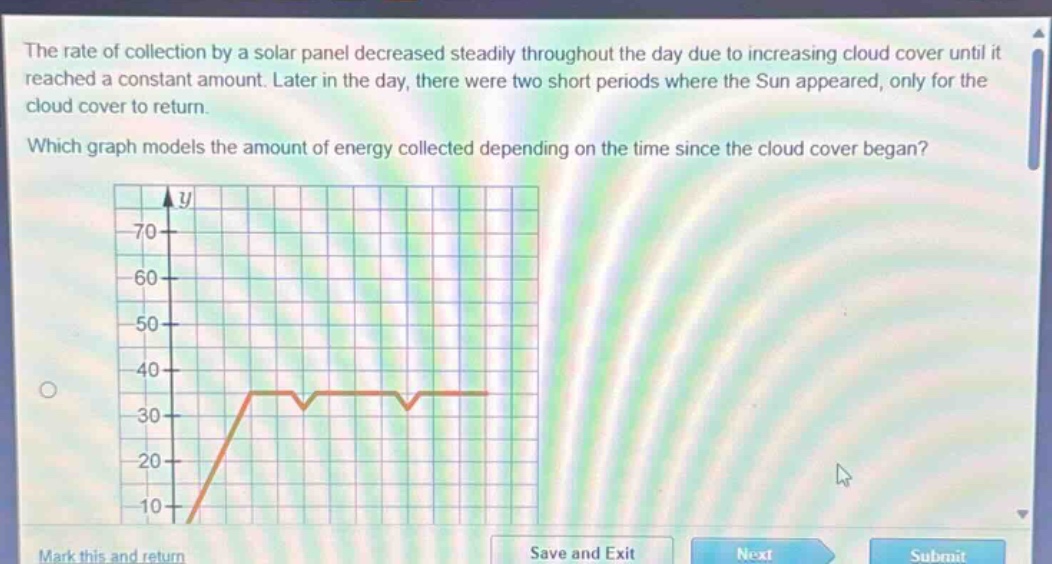
the rate of collection by a solar panel decreased steadily throughout the day due to increasing cloud cover until it reached a constant amount. later in the day, there were two short periods where the sun appeared, only for the cloud cover to return. which graph models the amount of energy collected depending on the time since the cloud cover began?
Answer
Explanation:
Step1: Analyze initial phase
The rate of collection decreases steadily until it reaches a constant. So, the graph should start with a decreasing - slope section and then level off.
Step2: Analyze later phase
There are two short periods where the Sun appears, causing a temporary increase in energy collection, followed by the return of cloud - cover and a return to the constant level.
Answer:
The given graph (with an initial increasing - then decreasing slope until it levels off, and two small upward - then downward bumps later) models the situation.