robs uncle took him to a motocross stunt show. one biker rode up a ramp from the ground and launched into…
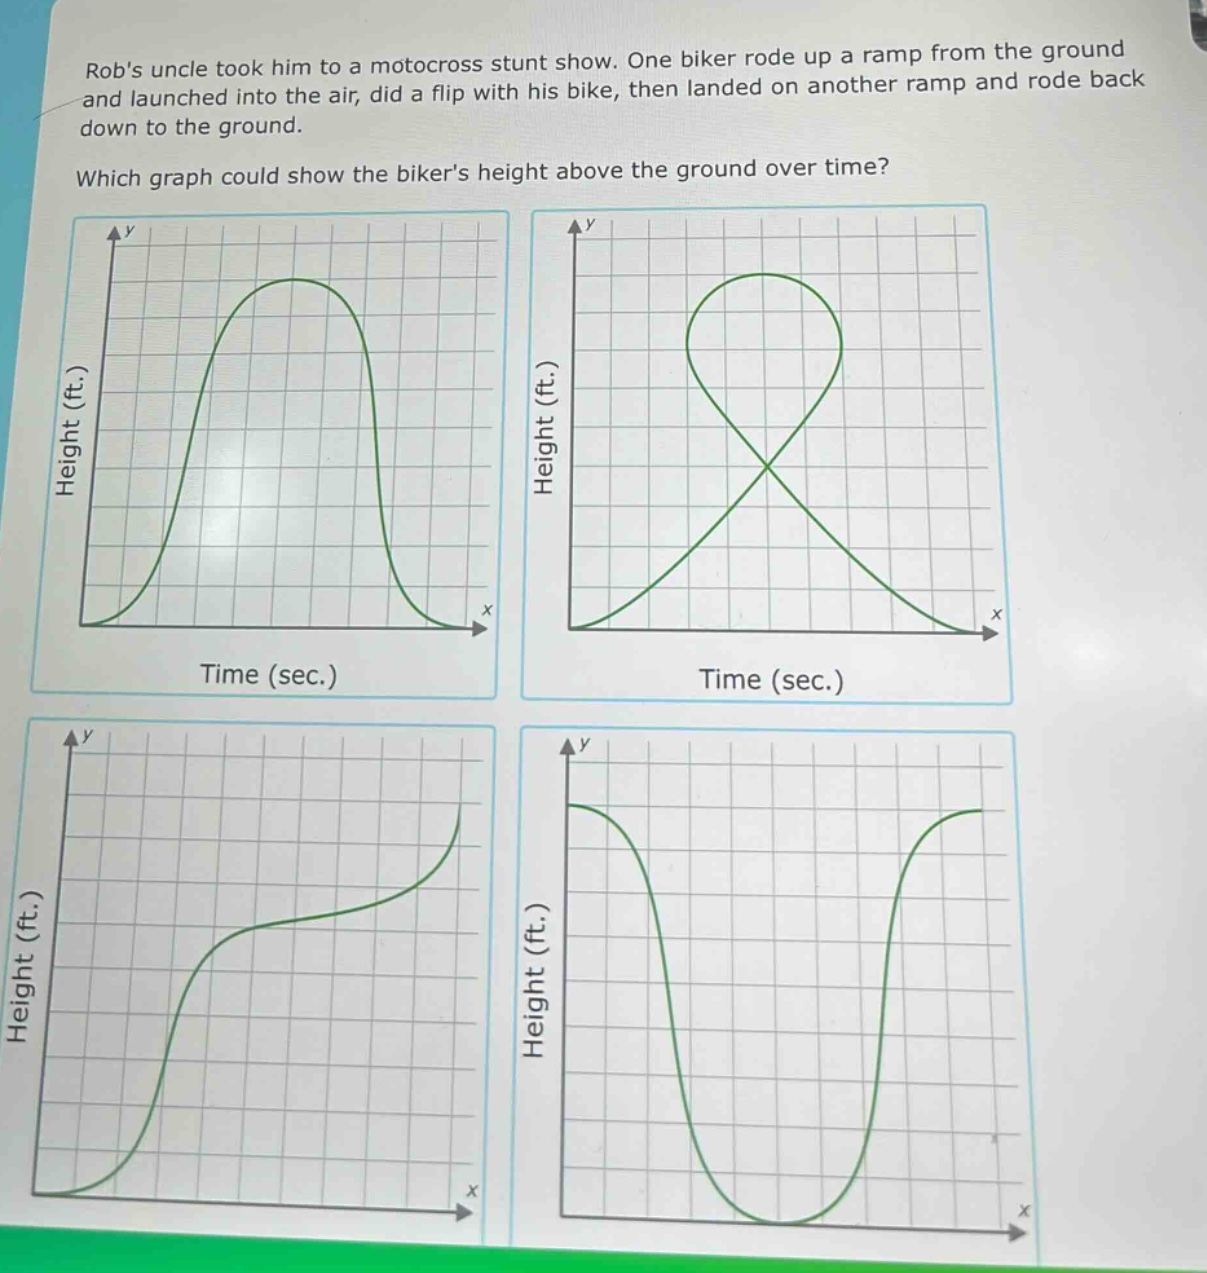
robs uncle took him to a motocross stunt show. one biker rode up a ramp from the ground and launched into the air, did a flip with his bike, then landed on another ramp and rode back down to the ground. which graph could show the bikers height above the ground over time?
Answer
Explanation:
Step1: Analyze the biker's motion
The biker starts on the ground (height = 0), rides up a ramp (height increases), launches into the air and reaches a maximum height, then comes down and lands on another ramp and rides back down to the ground (height decreases back to 0).
Step2: Evaluate each graph
The first - graph shows height starting at 0, increasing to a maximum, and then decreasing back to 0 which is consistent with the biker's motion. The second graph has an unrealistic loop - a single time value cannot correspond to two different height values in this context. The third graph shows a continuous increase in height which is not what happens as the biker comes back down. The fourth graph shows a decrease in height first which is not the case as the biker starts by going up.
Answer:
The first graph (the one with height starting at 0, increasing to a maximum, and then decreasing back to 0)