a rocket is launched in the air. the graph below shows the height of the rocket h in feet after t seconds…
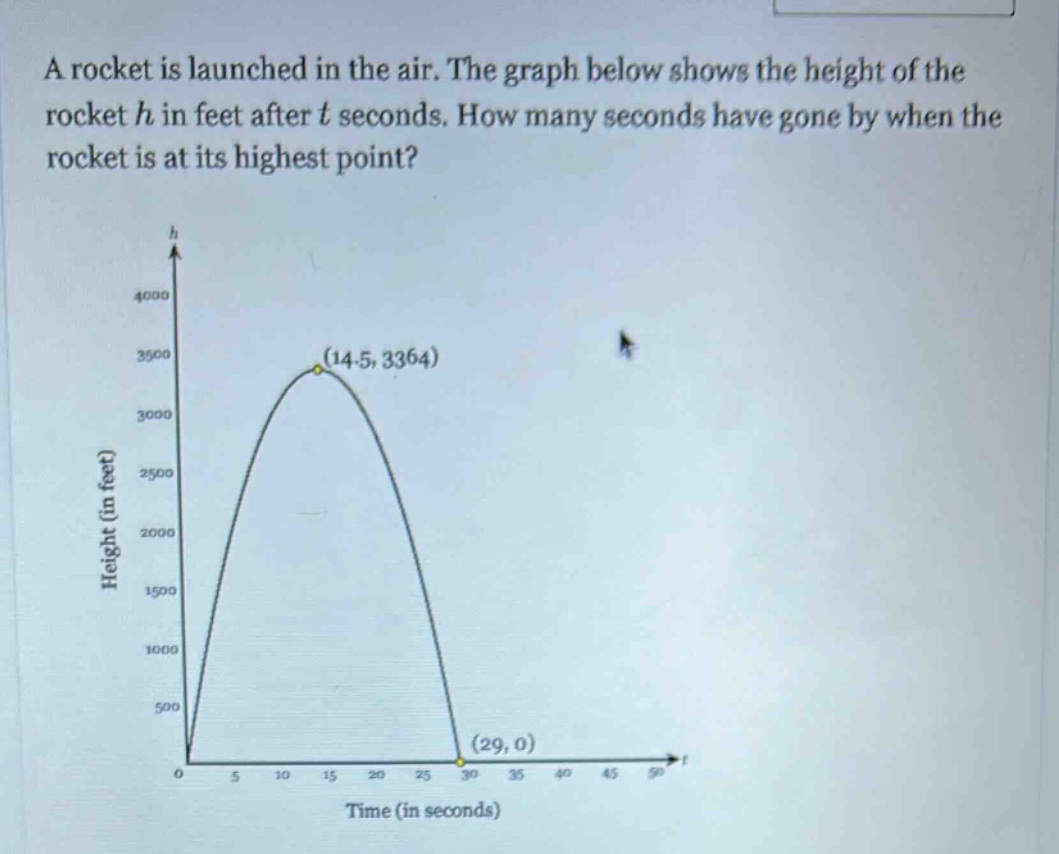
a rocket is launched in the air. the graph below shows the height of the rocket h in feet after t seconds. how many seconds have gone by when the rocket is at its highest point?
Answer
Explanation:
Step1: Identify the highest - point coordinates
The highest point of the graph of the rocket's height vs time is given as the vertex of the parabolic - shaped graph. The coordinates of the vertex are ((14.5,3364)), where the first value represents the time (t) and the second value represents the height (h).
Step2: Extract the time value
The time (t) at the highest - point is the (x) - coordinate of the vertex. From the point ((14.5,3364)), the time (t = 14.5) seconds.
Answer:
14.5