a rocket is launched in the air. the graph below shows the height of the rocket h in feet after t seconds…
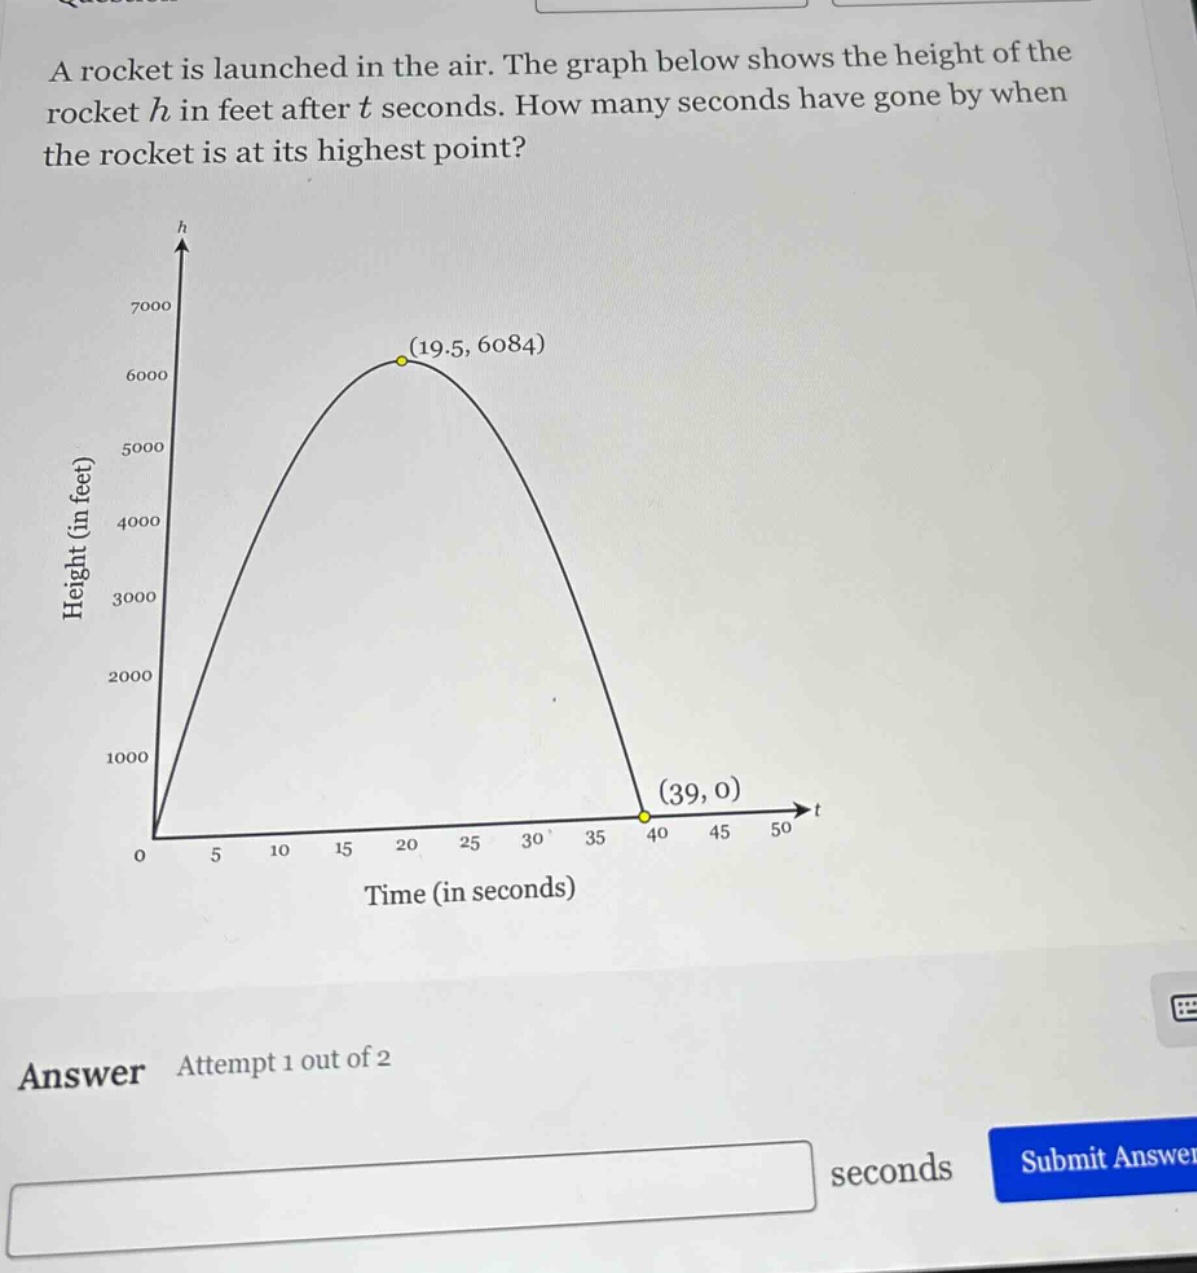
a rocket is launched in the air. the graph below shows the height of the rocket h in feet after t seconds. how many seconds have gone by when the rocket is at its highest point? answer attempt 1 out of 2 seconds submit answer
Answer
Explanation:
Step1: Identify the vertex of the parabola
The graph of the rocket's height is a parabola. The vertex of a parabola represents the maximum or minimum point. In this case, since the parabola opens down - ward, the vertex is the maximum point.
Step2: Read the x - coordinate of the vertex
The vertex of the parabola is given as the point $(19.5,6084)$. The $x$ - coordinate of the vertex represents the time $t$ when the rocket is at its highest point. The $x$ - coordinate is $19.5$.
Answer:
$19.5$