scarlett is teaching her little sister, cara, how to catch a football. scarlett holds the football in her…
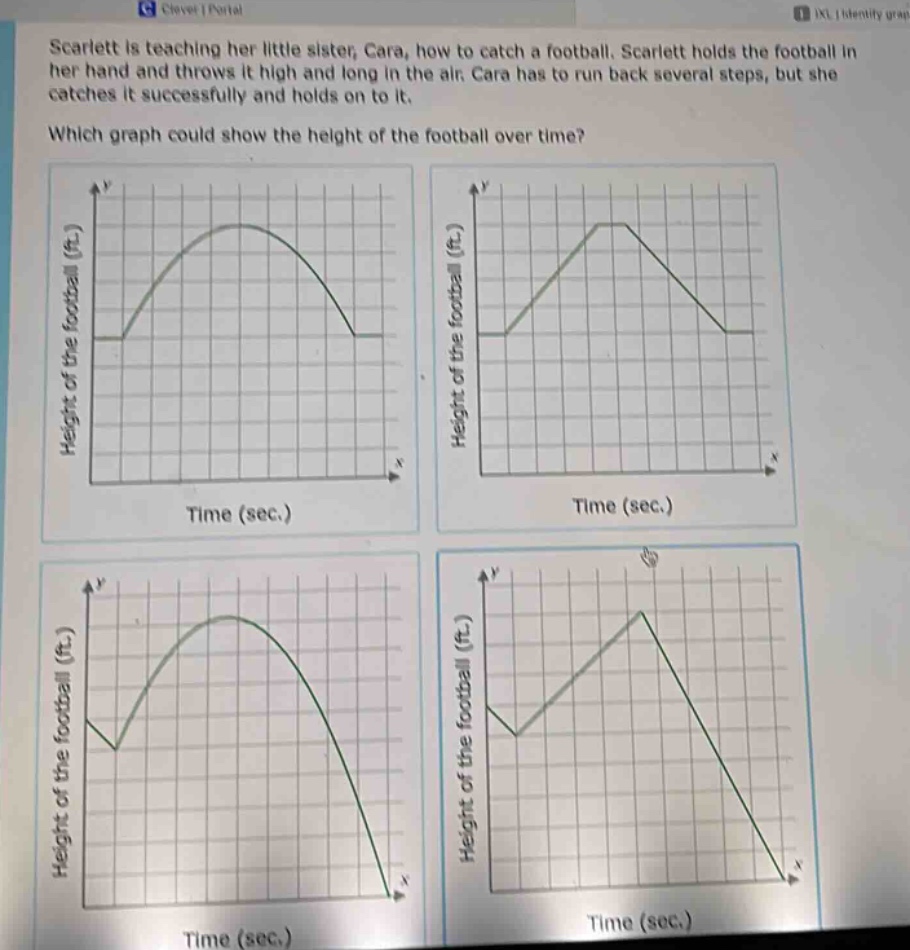
scarlett is teaching her little sister, cara, how to catch a football. scarlett holds the football in her hand and throws it high and long in the air. cara has to run back several steps, but she catches it successfully and holds on to it. which graph could show the height of the football over time? height of the football (ft.) time (sec.) height of the football (ft.) time (sec.) height of the football (ft.) time (sec.) height of the football (ft.) time (sec.)
Answer
Answer:
The top - left graph.
Explanation:
Step1: Analyze football motion
When the football is thrown, it first goes up, reaches a maximum height, then comes down.
Step2: Match with graph features
The top - left graph shows an initial increase in height (throwing up), a peak (maximum height), and then a decrease in height (coming down). The other graphs have incorrect starting points or shapes. For example, the top - right graph has a flat part in the middle which is not typical for a thrown football's motion. The bottom - left and bottom - right graphs start at a non - zero height which is not consistent with the description of starting from Scarlett's hand.