a scientist collected the following data, which show how the pressure of water vapor changes with…
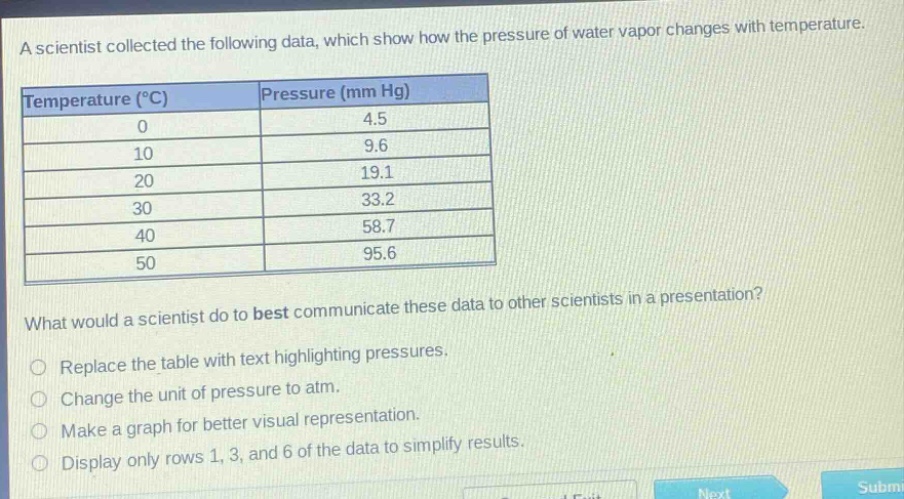
a scientist collected the following data, which show how the pressure of water vapor changes with temperature.\n| temperature (°c) | pressure (mm hg) |\n| ---- | ---- |\n| 0 | 4.5 |\n| 10 | 9.6 |\n| 20 | 19.1 |\n| 30 | 33.2 |\n| 40 | 58.7 |\n| 50 | 95.6 |\nwhat would a scientist do to best communicate these data to other scientists in a presentation?\n○ replace the table with text highlighting pressures.\n○ change the unit of pressure to atm.\n○ make a graph for better visual representation.\n○ display only rows 1, 3, and 6 of the data to simplify results.
Answer
Answer:
C. Make a graph for better visual representation.
Brief Explanations:
Graphs are effective for showing relationships between variables like temperature and pressure, making data more understandable in a presentation.