scientists are measuring a distant planets temperature. the graph shows the temperature (in °c) versus the…
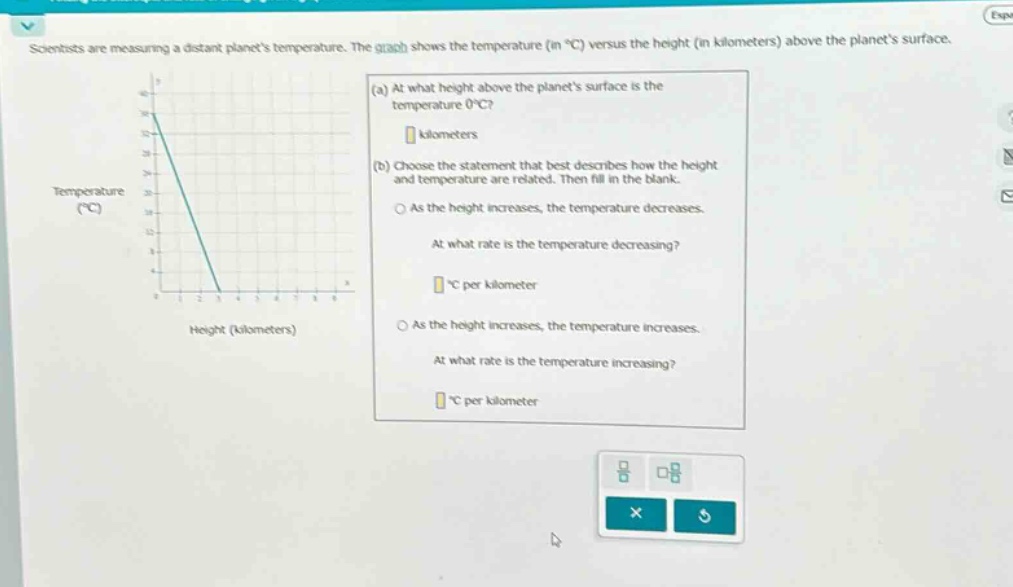
scientists are measuring a distant planets temperature. the graph shows the temperature (in °c) versus the height (in kilometers) above the planets surface. (a) at what height above the planets surface is the temperature 0°c? kilometers (b) choose the statement that best describes how the height and temperature are related. then fill in the blank. as the height increases, the temperature decreases. at what rate is the temperature decreasing? °c per kilometer as the height increases, the temperature increases. at what rate is the temperature increasing? °c per kilometer
Answer
Answer:
(a) 3 kilometers (b) As the height increases, the temperature decreases. 10 °C per kilometer
Explanation:
Step1: Locate temperature on graph
Find the point where temperature is 0°C on the graph. The corresponding height on the x - axis is 3 kilometers.
Step2: Analyze slope of line
The line on the graph is sloping downwards, so as height increases, temperature decreases.
Step3: Calculate rate of change
Pick two points, say (0, 30) and (3, 0). Rate of change = $\frac{\Delta y}{\Delta x}=\frac{0 - 30}{3-0}=- 10$ °C per kilometer. The magnitude of the rate of decrease is 10 °C per kilometer.