scientists are measuring a distant planets temperature. the graph shows the temperature (in °c) versus the…
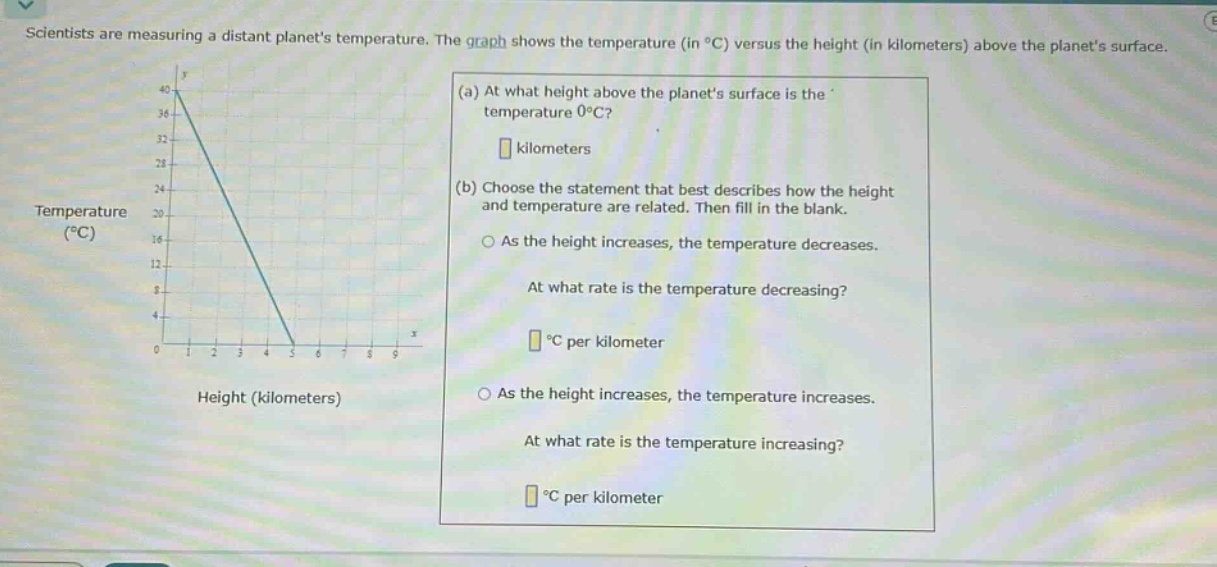
scientists are measuring a distant planets temperature. the graph shows the temperature (in °c) versus the height (in kilometers) above the planets surface. (a) at what height above the planets surface is the temperature 0°c? kilometers (b) choose the statement that best describes how the height and temperature are related. then fill in the blank. o as the height increases, the temperature decreases. at what rate is the temperature decreasing? °c per kilometer o as the height increases, the temperature increases. at what rate is the temperature increasing? °c per kilometer
Answer
Explanation:
Step1: Find temperature - height relation
From the graph, as height increases, temperature decreases.
Step2: Calculate rate of temperature change
The line passes through points (0, 40) and (5, 0). The rate of change (slope $m$) is given by the formula $m=\frac{y_2 - y_1}{x_2 - x_1}$. Here, $x_1 = 0,y_1 = 40,x_2=5,y_2 = 0$. So $m=\frac{0 - 40}{5-0}=\frac{- 40}{5}=-8$.
Step3: Find height at 0°C
From the graph, when $y = 0$, $x = 5$.
Answer:
(a) 5 (b) As the height increases, the temperature decreases. -8