select the correct answer. which segment of this graph shows a decreasing velocity? position (m) time (s) a…
select the correct answer. which segment of this graph shows a decreasing velocity? position (m) time (s) a. a to b b. b to c c. c to d d. d to e e. e to f
Answer
Explanation:
Step1: Recall velocity - position graph relationship
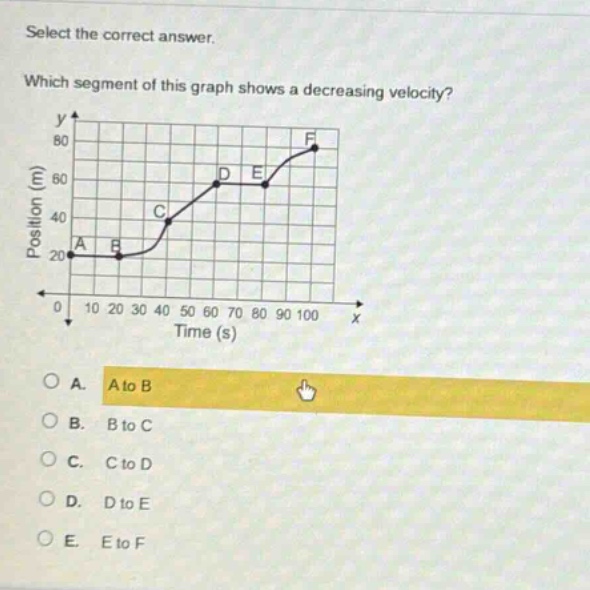
Velocity is the slope of the position - time graph. A decreasing velocity means the slope of the position - time graph is decreasing.
Step2: Analyze each segment
- For A to B: The slope is 0 (horizontal line), so velocity is constant (0).
- For B to C: The slope is positive and increasing.
- For C to D: The slope is positive and constant.
- For D to E: The slope is 0 (horizontal line), so velocity is constant (0).
- For E to F: The slope is positive but decreasing.
Answer:
E. E to F