select the correct location on the image. the lines on the position - time graph show the velocities of…
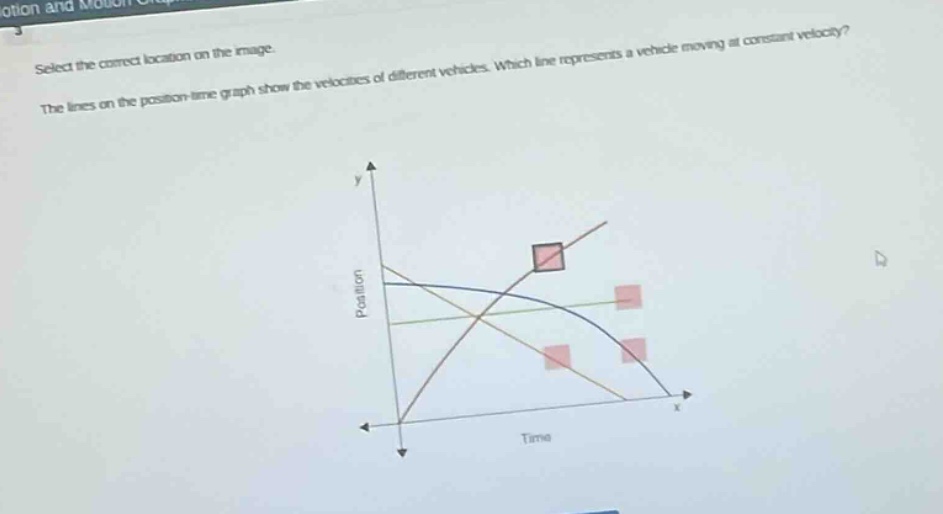
select the correct location on the image. the lines on the position - time graph show the velocities of different vehicles. which line represents a vehicle moving at constant velocity?
Answer
Explanation:
Step1: Recordar la relación entre posición - tiempo y velocidad
En un gráfico de posición - tiempo, la velocidad es la pendiente de la curva. Una velocidad constante significa que la pendiente es constante.
Step2: Identificar la curva con pendiente constante
Las curvas curvas representan aceleración o desaceleración (cambio en la velocidad). Una línea recta en un gráfico de posición - tiempo tiene una pendiente constante.
Answer:
La línea recta en el gráfico de posición - tiempo representa un vehículo moviéndose a velocidad constante.