select the correct locations on the table. the table shows the changes in velocity for several different…
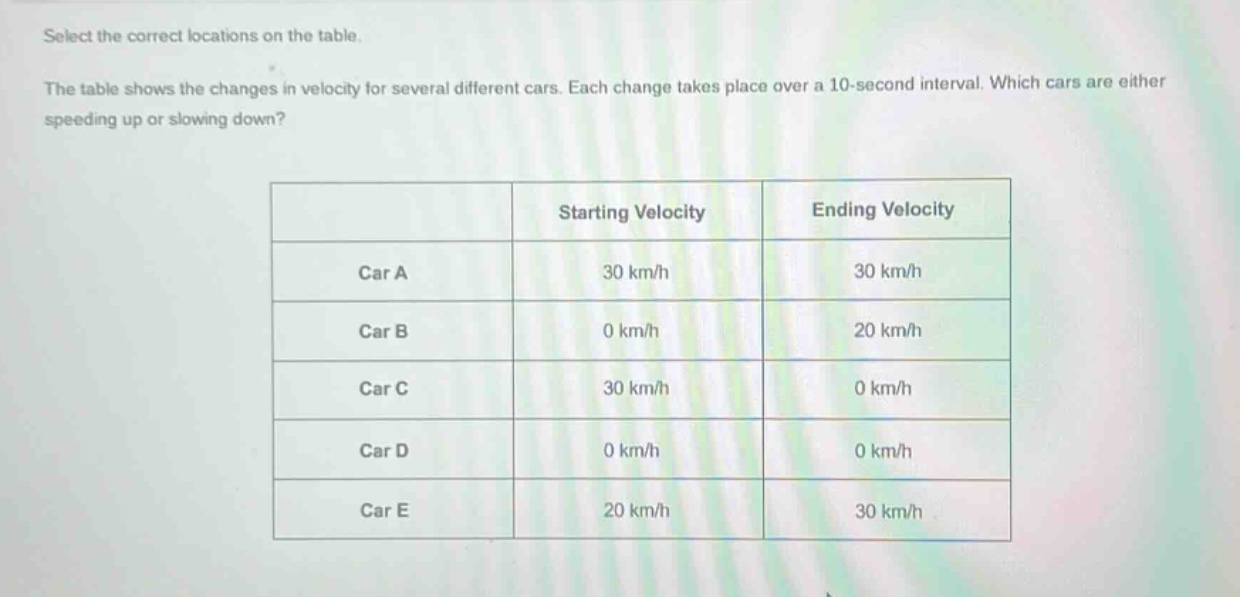
select the correct locations on the table. the table shows the changes in velocity for several different cars. each change takes place over a 10 - second interval. which cars are either speeding up or slowing down?\n| |starting velocity|ending velocity|\n|----|----|----|\n|car a|30 km/h|30 km/h|\n|car b|0 km/h|20 km/h|\n|car c|30 km/h|0 km/h|\n|car d|0 km/h|0 km/h|\n|car e|20 km/h|30 km/h|
Answer
Explanation:
Step1: Analyze Car A
Starting velocity = 30 km/h, Ending velocity = 30 km/h. Since they are equal, no speed - change.
Step2: Analyze Car B
Starting velocity = 0 km/h, Ending velocity = 20 km/h. Ending velocity > Starting velocity, car is speeding up.
Step3: Analyze Car C
Starting velocity = 30 km/h, Ending velocity = 0 km/h. Ending velocity < Starting velocity, car is slowing down.
Step4: Analyze Car D
Starting velocity = 0 km/h, Ending velocity = 0 km/h. Since they are equal, no speed - change.
Step5: Analyze Car E
Starting velocity = 20 km/h, Ending velocity = 30 km/h. Ending velocity > Starting velocity, car is speeding up.
Answer:
Car B, Car C, Car E