the speed of a falling object increases at a constant rate as time increases since the object was dropped…
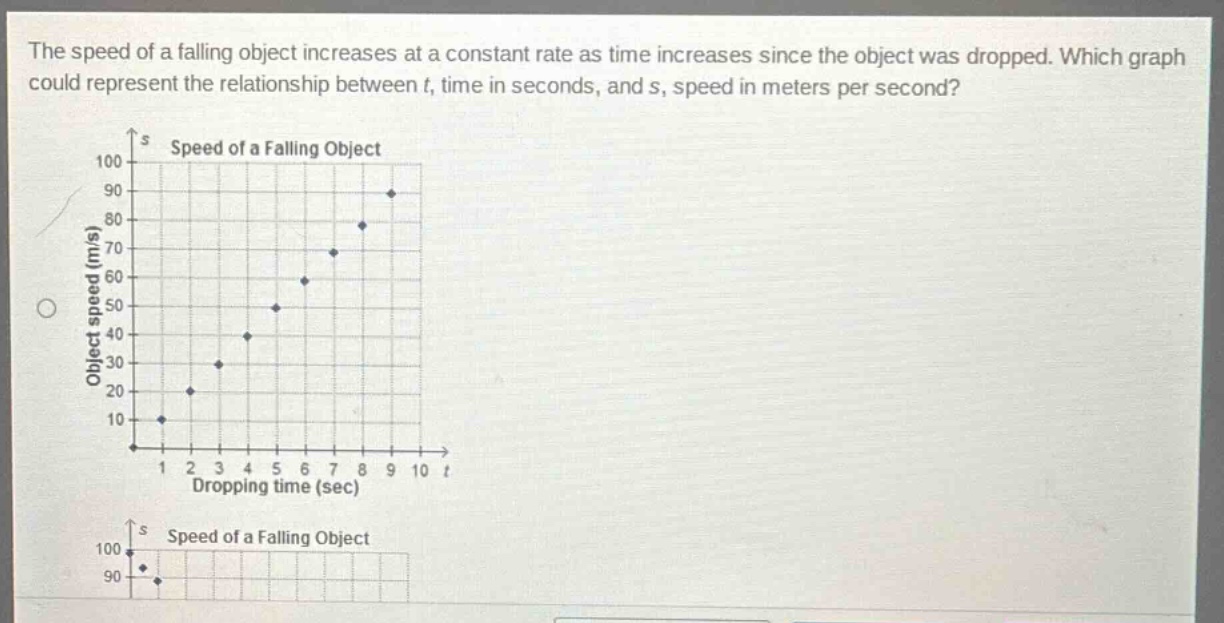
the speed of a falling object increases at a constant rate as time increases since the object was dropped. which graph could represent the relationship between t, time in seconds, and s, speed in meters per second?
Answer
Explanation:
Step1: Identify the relationship type
The speed of the falling - object increases at a constant rate with time. This is a linear relationship of the form (s = kt) (where (k) is the constant of proportionality, and in the context of free - fall near the Earth's surface (k = g\approx9.8\ m/s^{2})), and the graph of a linear relationship (y = mx + b) (in our case (s=kt + 0) since the initial speed when (t = 0) is (0)) is a straight line.
Step2: Analyze the given graphs
The first graph shows points that can be connected by a straight line, indicating a constant rate of change of speed with respect to time. The second graph has only two points and does not show the continuous increase over time as required.
Answer:
The first graph (the one with multiple points that can be connected by a straight line)