which statement describes how phase changes can be diagrammed as a substance is heated? the phase is on the…
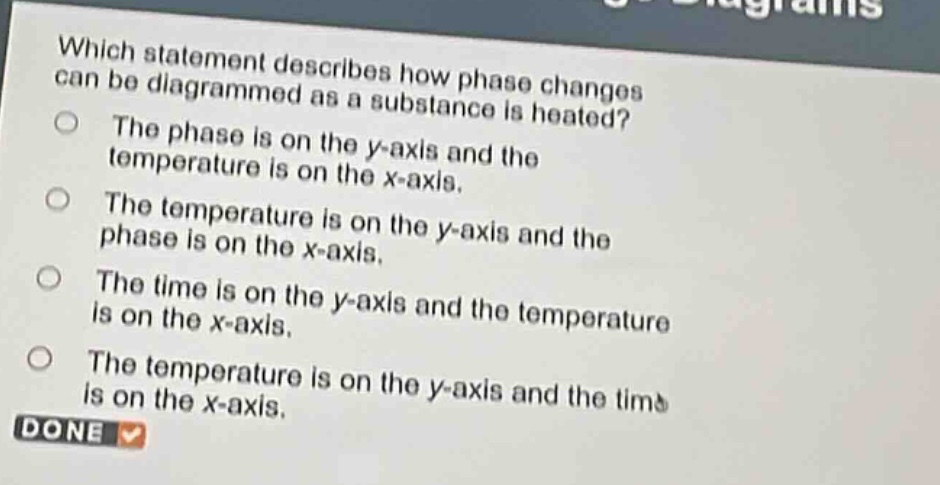
which statement describes how phase changes can be diagrammed as a substance is heated? the phase is on the y - axis and the temperature is on the x - axis. the temperature is on the y - axis and the phase is on the x - axis. the time is on the y - axis and the temperature is on the x - axis. the temperature is on the y - axis and the time is on the x - axis.
Answer
Brief Explanations:
When diagramming phase - changes as a substance is heated, temperature is plotted on the y - axis and time is plotted on the x - axis. This is because we observe how the temperature of the substance changes over time as heat is added during phase - transitions like melting and boiling.
Answer:
The temperature is on the y - axis and the time is on the x - axis.