a student conducted an investigation seeking to determine the relationship between two properties of a gas…
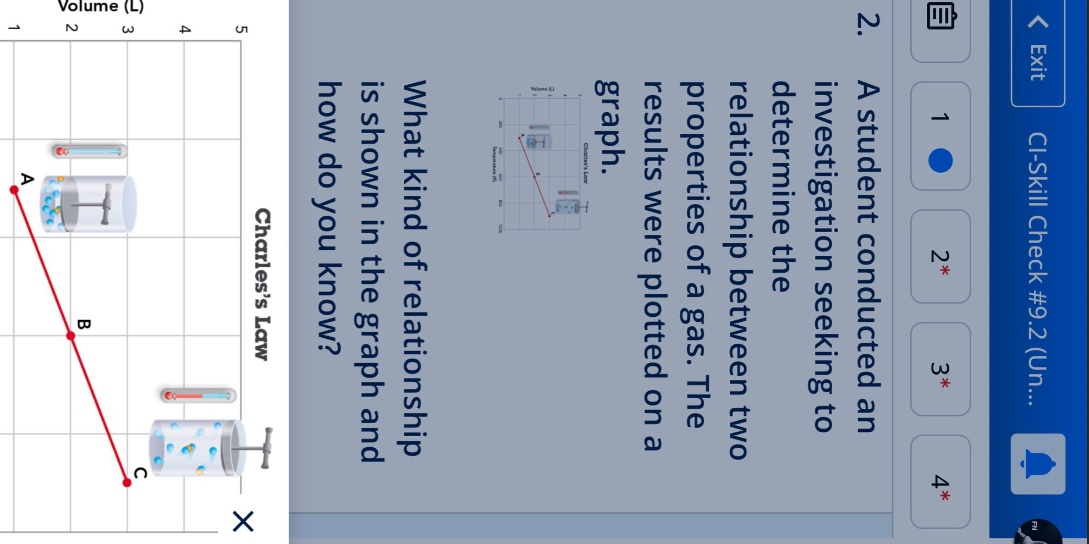
a student conducted an investigation seeking to determine the relationship between two properties of a gas. the results were plotted on a graph. what kind of relationship is shown in the graph and how do you know? charless law
Answer
Explanation:
Step1: Analyze graph type
The graph is a straight - line graph.
Step2: Recall relationship types
A straight - line graph represents a linear relationship. In the context of Charles's Law, the volume of a gas is linearly related to its temperature (at constant pressure).
Answer:
The relationship shown in the graph is a linear relationship. We know this because the graph is a straight line, which is characteristic of a linear relationship where one variable changes at a constant rate with respect to the other variable.