the table represents the speed of a car in a northern direction over several seconds. column 1 would be on…
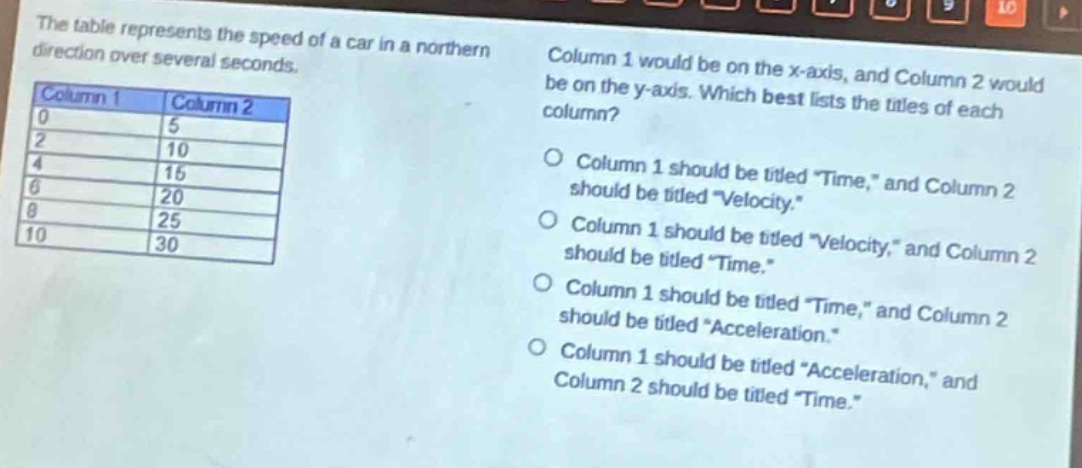
the table represents the speed of a car in a northern direction over several seconds. column 1 would be on the x - axis, and column 2 would be on the y - axis. which best lists the titles of each column? column 1 should be titled \time,\ and column 2 should be titled \velocity.\ column 1 should be titled \velocity,\ and column 2 should be titled \time.\ column 1 should be titled \time,\ and column 2 should be titled \acceleration.\ column 1 should be titled \acceleration,\ and column 2 should be titled \time.\
Answer
Brief Explanations:
In a graph representing motion, time is usually plotted on the x - axis and velocity (speed with direction) is plotted on the y - axis. The table shows values over several seconds (time) and the speed (magnitude of velocity) of the car.
Answer:
Column 1 should be titled "Time," and Column 2 should be titled "Velocity."