2. the table shown represents the position of a cart at various instants in time.\n| time (second) |…
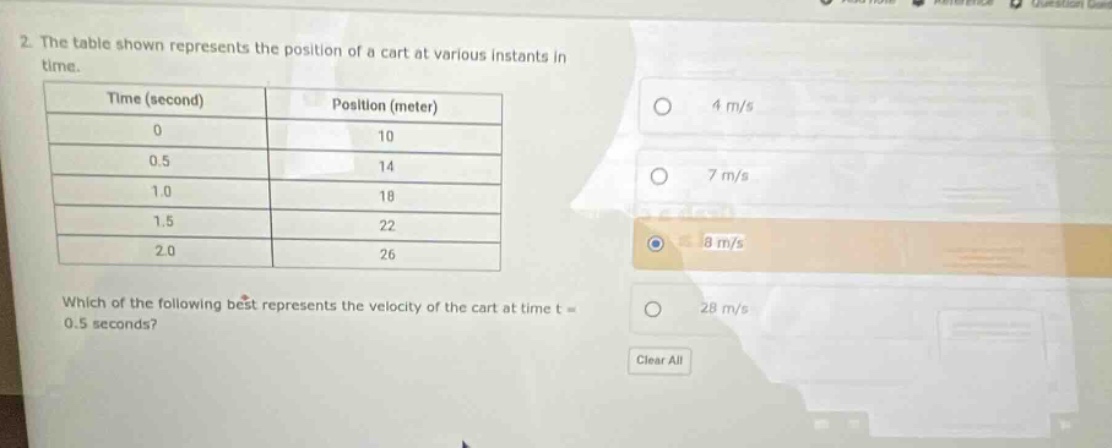
2. the table shown represents the position of a cart at various instants in time.\n| time (second) | position (meter) |\n| ---- | ---- |\n| 0 | 10 |\n| 0.5 | 14 |\n| 1.0 | 18 |\n| 1.5 | 22 |\n| 2.0 | 26 |\nwhich of the following best represents the velocity of the cart at time t = 0.5 seconds?\n4 m/s\n7 m/s\n8 m/s\n28 m/s\nclear all
Answer
Explanation:
Step1: Recall velocity formula
Velocity $v=\frac{\Delta x}{\Delta t}$, where $\Delta x$ is change in position and $\Delta t$ is change in time.
Step2: Determine $\Delta x$ and $\Delta t$ around $t = 0.5$ s
We can use the data points at $t=0$ s and $t = 1.0$ s. $\Delta t=1.0 - 0=1.0$ s, $\Delta x=18 - 10 = 8$ m.
Step3: Calculate velocity
$v=\frac{\Delta x}{\Delta t}=\frac{8}{1}=8$ m/s.
Answer:
8 m/s