the table shows the temperature of an amount of water set on a stove to boil, recorded every half minute…
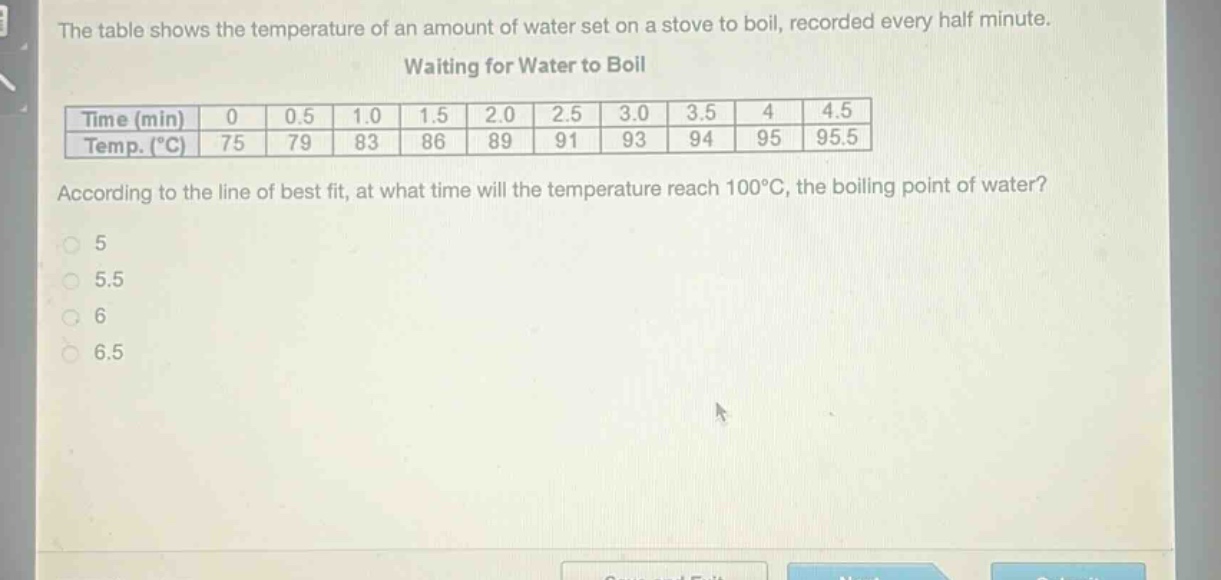
the table shows the temperature of an amount of water set on a stove to boil, recorded every half minute. waiting for water to boil\n| time (min) | 0 | 0.5 | 1.0 | 1.5 | 2.0 | 2.5 | 3.0 | 3.5 | 4 | 4.5 |\n| temp. (°c) | 75 | 79 | 83 | 86 | 89 | 91 | 93 | 94 | 95 | 95.5 |\naccording to the line of best fit, at what time will the temperature reach 100°c, the boiling point of water?\n5\n5.5\n6\n6.5
Answer
Explanation:
Step1: Assume linear - relationship
Let the time be $x$ (in minutes) and the temperature be $y$ (in $^{\circ}C$). We assume a linear equation of the form $y = mx + b$. We take two points from the table, say $(0,75)$ and $(4.5,95.5)$. The slope $m=\frac{y_2 - y_1}{x_2 - x_1}=\frac{95.5 - 75}{4.5-0}=\frac{20.5}{4.5}=\frac{41}{9}\approx4.56$. Using the point - slope form with the point $(0,75)$ (where $b = 75$), the equation of the line is $y=\frac{41}{9}x + 75$.
Step2: Solve for $x$ when $y = 100$
Set $y = 100$ in the equation $y=\frac{41}{9}x + 75$. $100=\frac{41}{9}x+75$. Subtract 75 from both sides: $100 - 75=\frac{41}{9}x$, so $25=\frac{41}{9}x$. Then $x=\frac{25\times9}{41}=\frac{225}{41}\approx5.5$.
Answer:
5.5