the temperature of a substance was recorded over several minutes, as shown in the graph below. the graph…
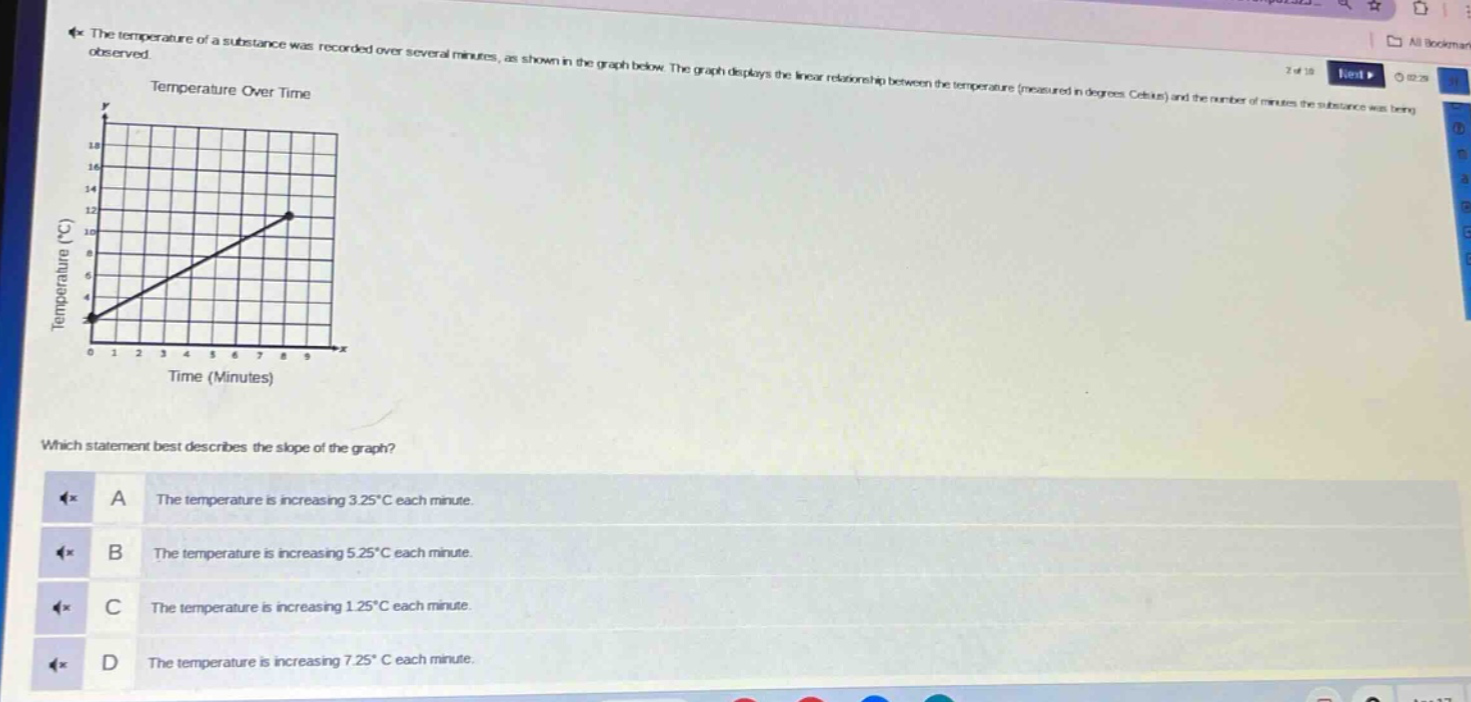
the temperature of a substance was recorded over several minutes, as shown in the graph below. the graph displays the linear relationship between the temperature (measured in degrees celsius) and the number of minutes the substance was being observed. temperature over time which statement best describes the slope of the graph? a the temperature is increasing 3.25°c each minute. b the temperature is increasing 5.25°c each minute. c the temperature is increasing 1.25°c each minute. d the temperature is increasing 7.25°c each minute.
Answer
Explanation:
Step1: Identify two points on the line
Let's take the points (0, 2) and (8, 12).
Step2: Use slope - formula
The slope formula is $m=\frac{y_2 - y_1}{x_2 - x_1}$. Here, $x_1 = 0,y_1 = 2,x_2=8,y_2 = 12$. So $m=\frac{12 - 2}{8-0}=\frac{10}{8}=1.25$.
Answer:
C. The temperature is increasing 1.25°C each minute.