test yourself! practice tool\nthe following table represents amount of vanadium - 49 remaining in a sample…
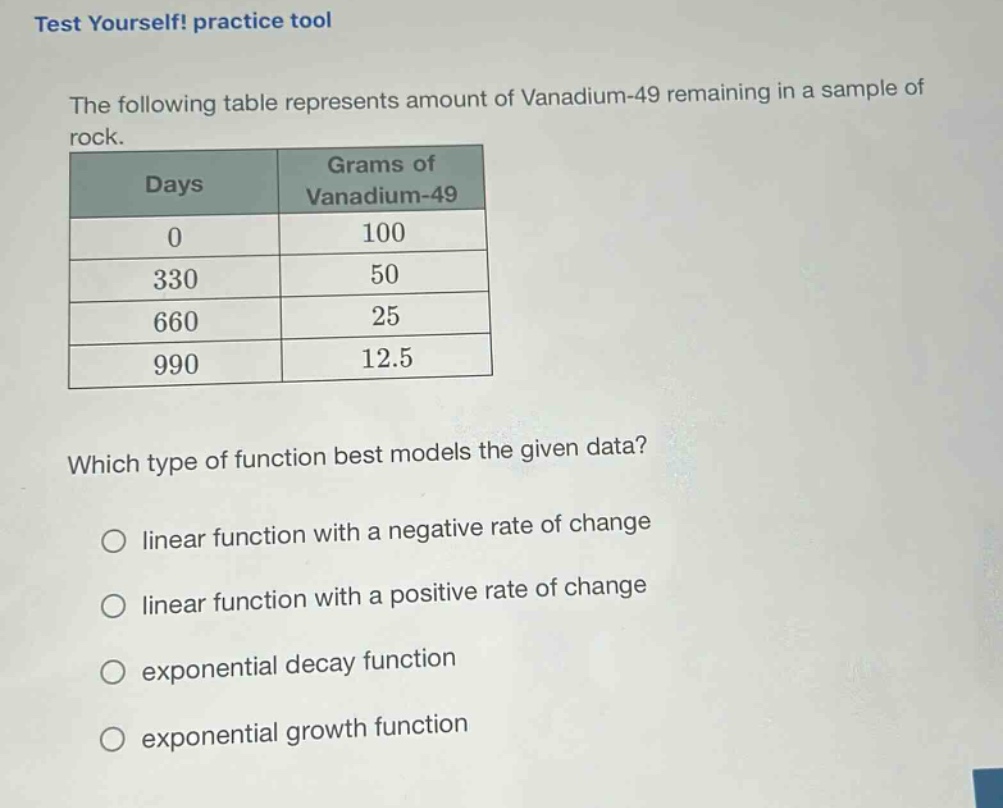
test yourself! practice tool\nthe following table represents amount of vanadium - 49 remaining in a sample of rock.\n| days | grams of vanadium - 49 |\n| ---- | ---- |\n| 0 | 100 |\n| 330 | 50 |\n| 660 | 25 |\n| 990 | 12.5 |\nwhich type of function best models the given data?\no linear function with a negative rate of change\no linear function with a positive rate of change\no exponential decay function\no exponential growth function
Answer
Answer:
exponential decay function
Explanation:
Step1: Analyze rate of change
As days increase, grams of Vanadium - 49 decrease.
Step2: Check linearity
The change in grams is not constant for equal - intervals of days. For example, from day 0 to 330, it changes by 50 grams, from 330 to 660 by 25 grams. So it's not linear.
Step3: Determine exponential type
Since the amount of Vanadium - 49 is decreasing over time and the rate of decrease is not constant (characteristic of exponential functions), and the amount is getting smaller, it is an exponential decay function.