test yourself! practice tool\nthe following table represents amount of vanadium - 49 remaining in a sample…
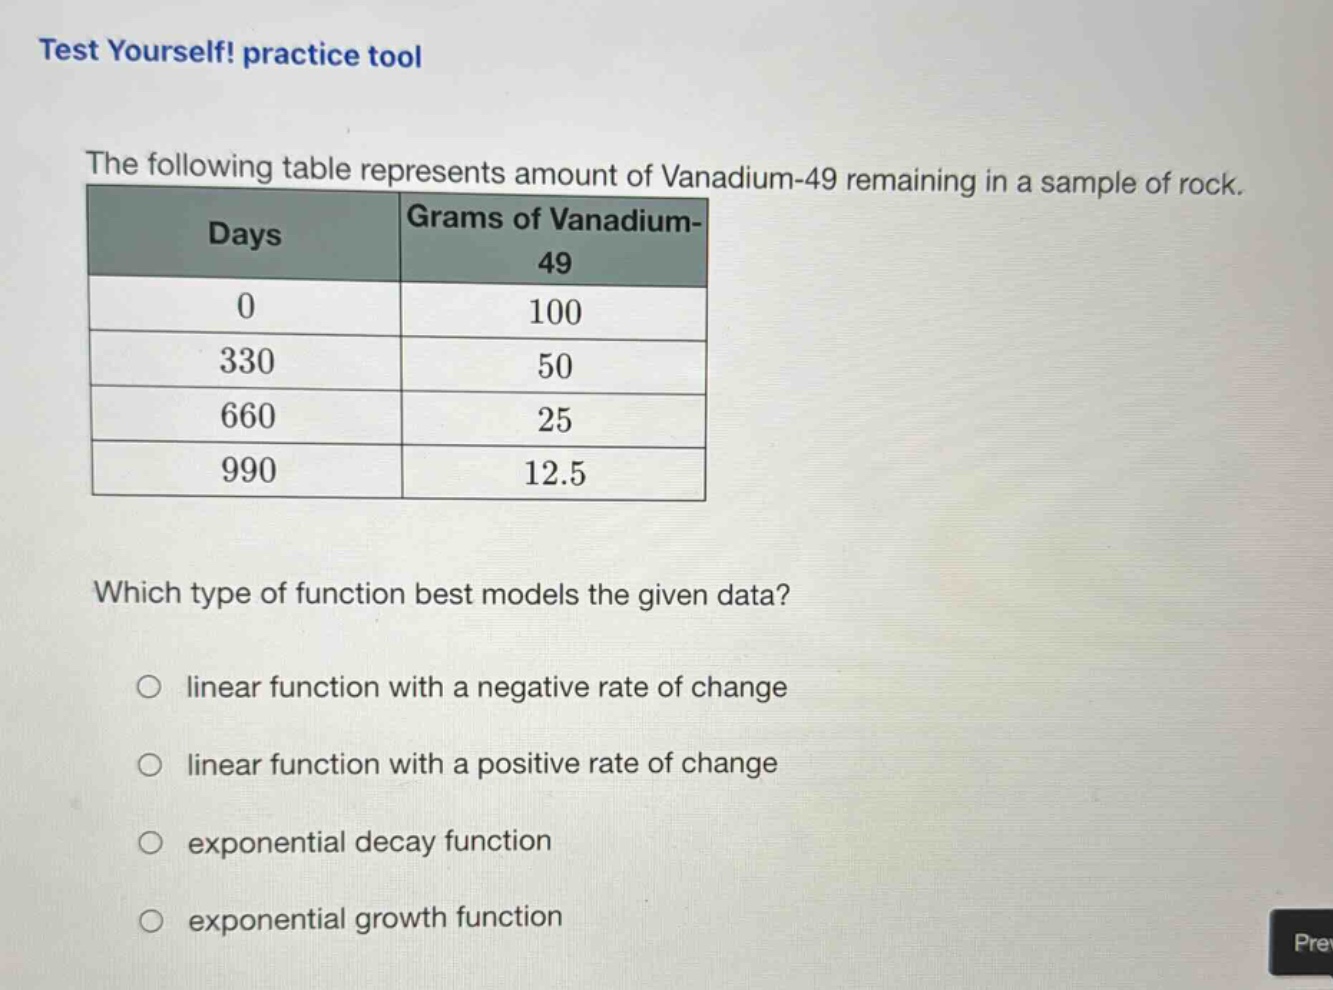
test yourself! practice tool\nthe following table represents amount of vanadium - 49 remaining in a sample of rock.\n| days | grams of vanadium - 49 |\n| ---- | ---- |\n| 0 | 100 |\n| 330 | 50 |\n| 660 | 25 |\n| 990 | 12.5 |\nwhich type of function best models the given data?\n○ linear function with a negative rate of change\n○ linear function with a positive rate of change\n○ exponential decay function\n○ exponential growth function
Answer
Explanation:
Step1: Analyze rate of change
When time (days) increases from 0 to 330, the amount of Vanadium - 49 decreases from 100 to 50. When time increases from 330 to 660, it decreases from 50 to 25. And from 660 to 990, it decreases from 25 to 12.5. The ratio of the amount of Vanadium - 49 at consecutive time - intervals is constant. For example, $\frac{50}{100}=\frac{1}{2}$, $\frac{25}{50}=\frac{1}{2}$, $\frac{12.5}{25}=\frac{1}{2}$.
Step2: Recall function types
A linear function has a constant difference in the output for a constant difference in the input. Here, the difference in the amount of Vanadium - 49 is not constant. An exponential function has a constant ratio in the output for a constant difference in the input. Since the ratio of the amount of Vanadium - 49 is constant and it is decreasing as time increases, it is an exponential decay function.
Answer:
exponential decay function