which type of function best models the data in the table?\nlinear\nexponential\nquadratic\ninverse…
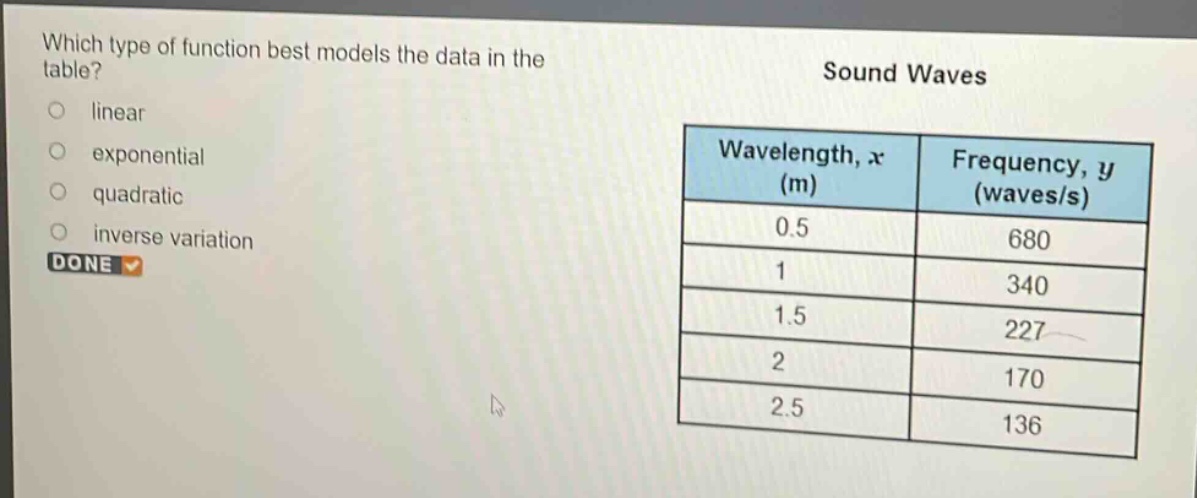
which type of function best models the data in the table?\nlinear\nexponential\nquadratic\ninverse variation\ndone\nsound waves\nwavelength, x (m)\tfrequency, y (waves/s)\n0.5\t680\n1\t340\n1.5\t227\n2\t170\n2.5\t136
Answer
Explanation:
Step1: Check for linear relationship
For a linear relationship, the difference in $y$ - values for a constant difference in $x$ - values should be constant. The difference in $x$ - values is $0.5$ each time. The differences in $y$ - values are: $340 - 680=- 340$, $227 - 340=-113$, etc. Since the differences in $y$ - values are not constant, it is not linear.
Step2: Check for exponential relationship
For an exponential relationship, the ratio of consecutive $y$ - values for a constant difference in $x$ - values should be constant. $\frac{340}{680}=\frac{1}{2}$, $\frac{227}{340}\approx0.67$, since the ratios are not constant, it is not exponential.
Step3: Check for quadratic relationship
A quadratic relationship has a non - constant second - difference. We have already seen that the first - differences are non - constant, but without further complex calculations, we can rule it out as the behavior doesn't match typical quadratic behavior.
Step4: Check for inverse variation
For inverse variation, the product $xy$ should be constant. $0.5\times680 = 340$, $1\times340=340$, $1.5\times227\approx340.5$, $2\times170 = 340$, $2.5\times136=340$. The products are approximately equal.
Answer:
inverse variation