understanding a graph\nbriefly describe this graph of a ferris wheel.\nheight\ntime
understanding a graph\nbriefly describe this graph of a ferris wheel.\nheight\ntime
Answer
Brief Explanations:
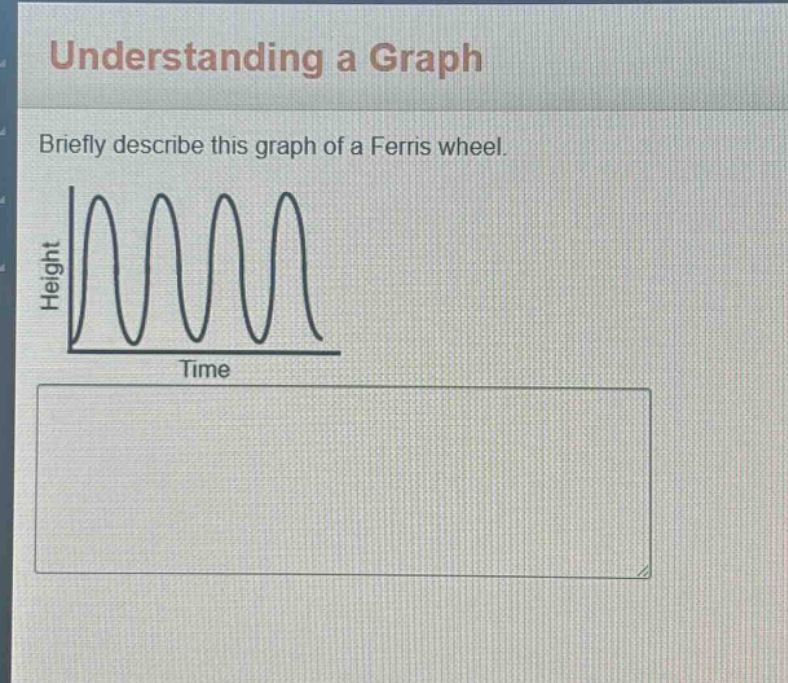
The graph shows the height of a Ferris - wheel rider over time. It is a periodic function, with the height repeating at regular intervals as the Ferris wheel rotates. The peaks represent the highest points of the Ferris wheel and the troughs represent the lowest points.
Answer:
The graph depicts the periodic variation of the height of a Ferris - wheel rider with respect to time, showing regular cycles of ascending and descending as the Ferris wheel turns.