use the information in the table to describe the temperature - vs. - time diagrams. which number on the…
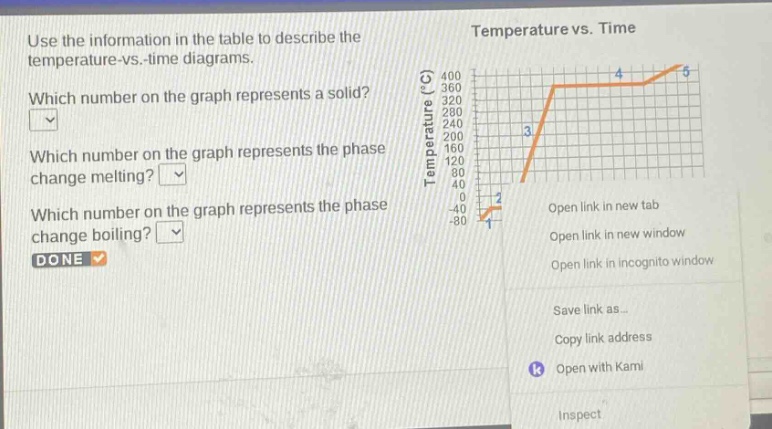
use the information in the table to describe the temperature - vs. - time diagrams. which number on the graph represents a solid? which number on the graph represents the phase change melting? which number on the graph represents the phase change boiling? done
Answer
Explanation:
Step1: Identify solid state
In a temperature - vs - time graph, a solid is at the lowest temperature before melting starts. Here, 1 represents the solid as it is at the initial low - temperature stage.
Step2: Identify melting phase change
Melting is the phase change from solid to liquid and is represented by a horizontal line where temperature remains constant while heat is being used for the phase transition. So, 2 represents the melting phase change.
Step3: Identify boiling phase change
Boiling is the phase change from liquid to gas and is also represented by a horizontal line at a higher temperature compared to melting. Thus, 4 represents the boiling phase change.
Answer:
Which number on the graph represents a solid? 1 Which number on the graph represents the phase change melting? 2 Which number on the graph represents the phase change boiling? 4