this velocity-time graph depicts the motion of an object. use the graph to determine the acceleration (in…
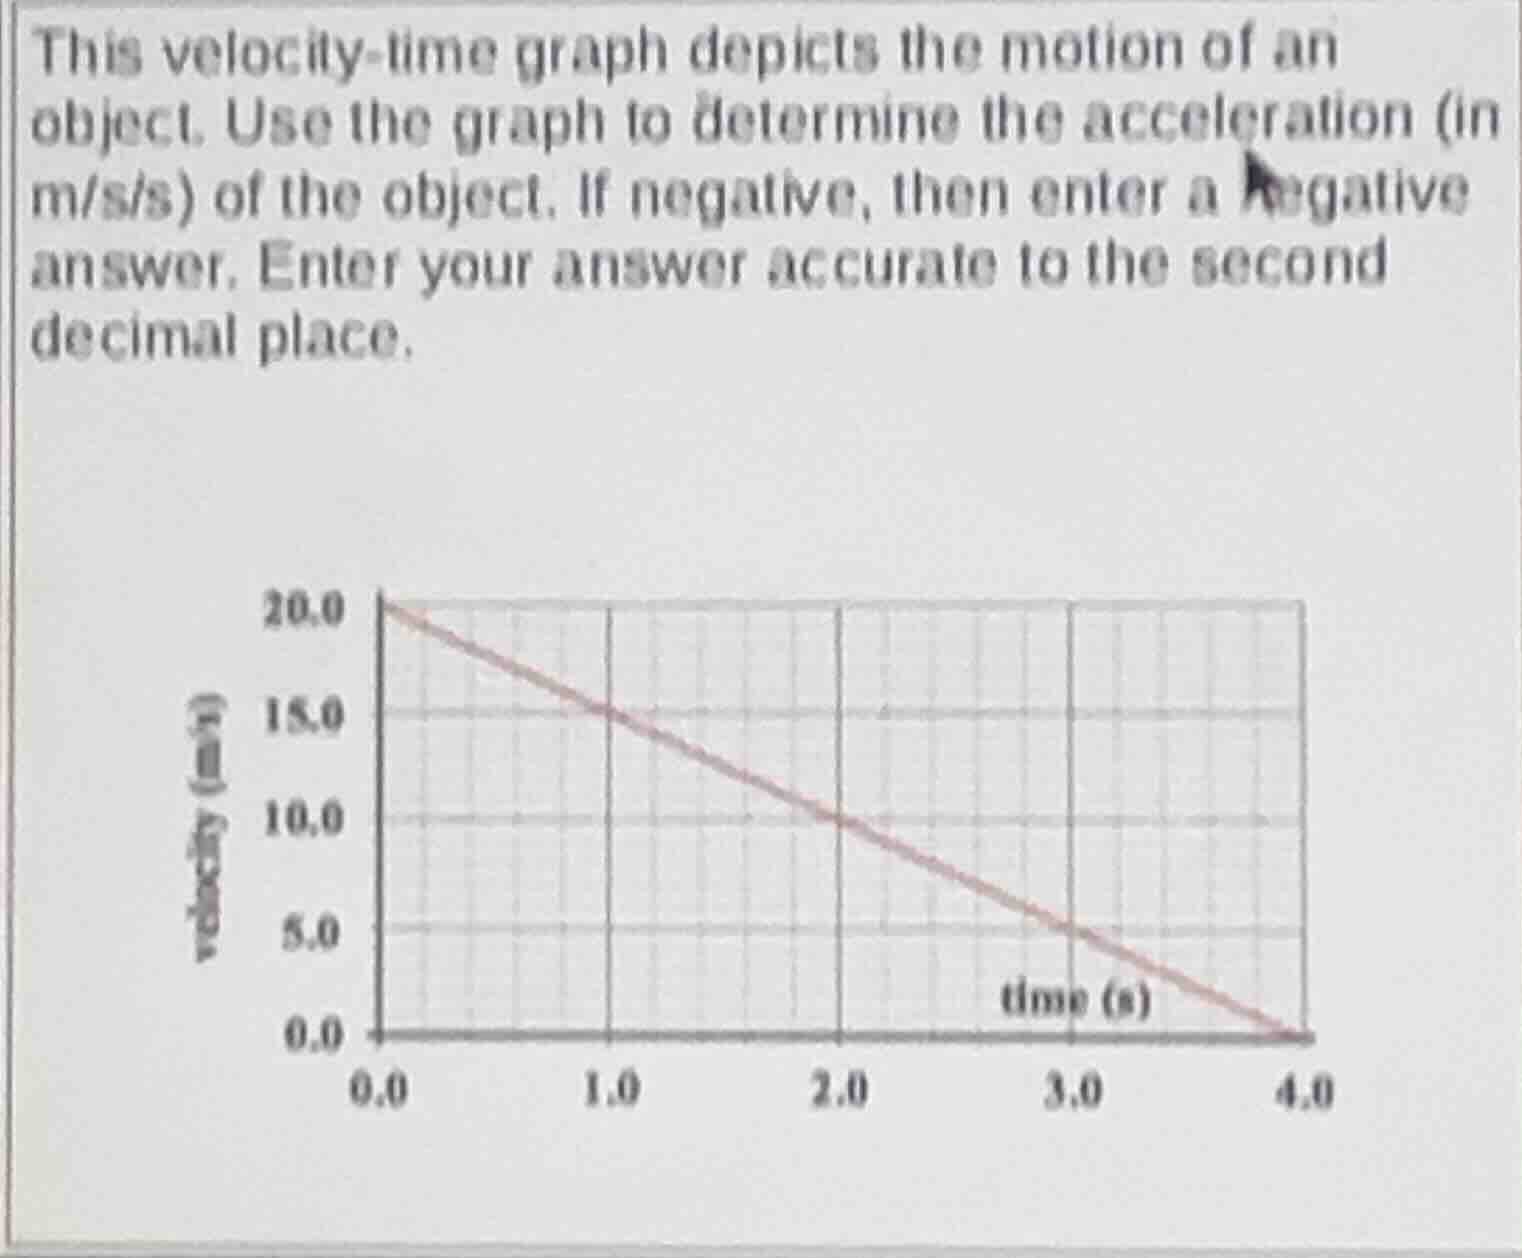
this velocity-time graph depicts the motion of an object. use the graph to determine the acceleration (in m/s/s) of the object. if negative, then enter a negative answer. enter your answer accurate to the second decimal place.
Answer
Explanation:
Step1: Identificar valores iniciales y finales
Tomamos $v_0 = 20.0 , \text{m/s}$ en $t_0 = 0.0 , \text{s}$, y $v_f = 0.0 , \text{m/s}$ en $t_f = 4.0 , \text{s}$.
Step2: Aplicar fórmula de aceleración
La aceleración es el cambio de velocidad entre el cambio de tiempo: $$a = \frac{v_f - v_0}{t_f - t_0}$$ Sustituimos los valores: $$a = \frac{0.0 - 20.0}{4.0 - 0.0} = \frac{-20.0}{4.0}$$
Step3: Calcular el resultado
$$a = -5.00$$
Answer:
$-5.00$