which velocity vs. time graph corresponds to the data represented by the position vs. time graph? position…
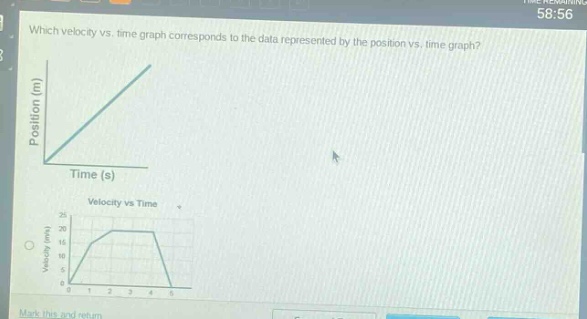
which velocity vs. time graph corresponds to the data represented by the position vs. time graph? position (m) time (s) velocity vs time
Answer
Answer:
The velocity - time graph corresponding to a linear position - time graph is a horizontal line. Since the position - time graph is a straight line (indicating a constant slope), the velocity is constant. A constant velocity is represented by a horizontal line on a velocity - time graph. So, the correct velocity - time graph is a horizontal line at a non - zero value (because the position is changing with time, so there is a non - zero velocity).
Explanation:
Step1: Recall the relationship between position and velocity
Velocity $v=\frac{\Delta x}{\Delta t}$, which is the slope of the position - time graph.
Step2: Analyze the position - time graph
The given position - time graph is a straight line. A straight - line position - time graph has a constant slope.
Step3: Determine the velocity
Since the slope of the position - time graph is constant, the velocity is constant. A constant velocity is shown as a horizontal line on a velocity - time graph.