while batting at softball practice, layla had a great hit. the ball traveled high and fast in the air…
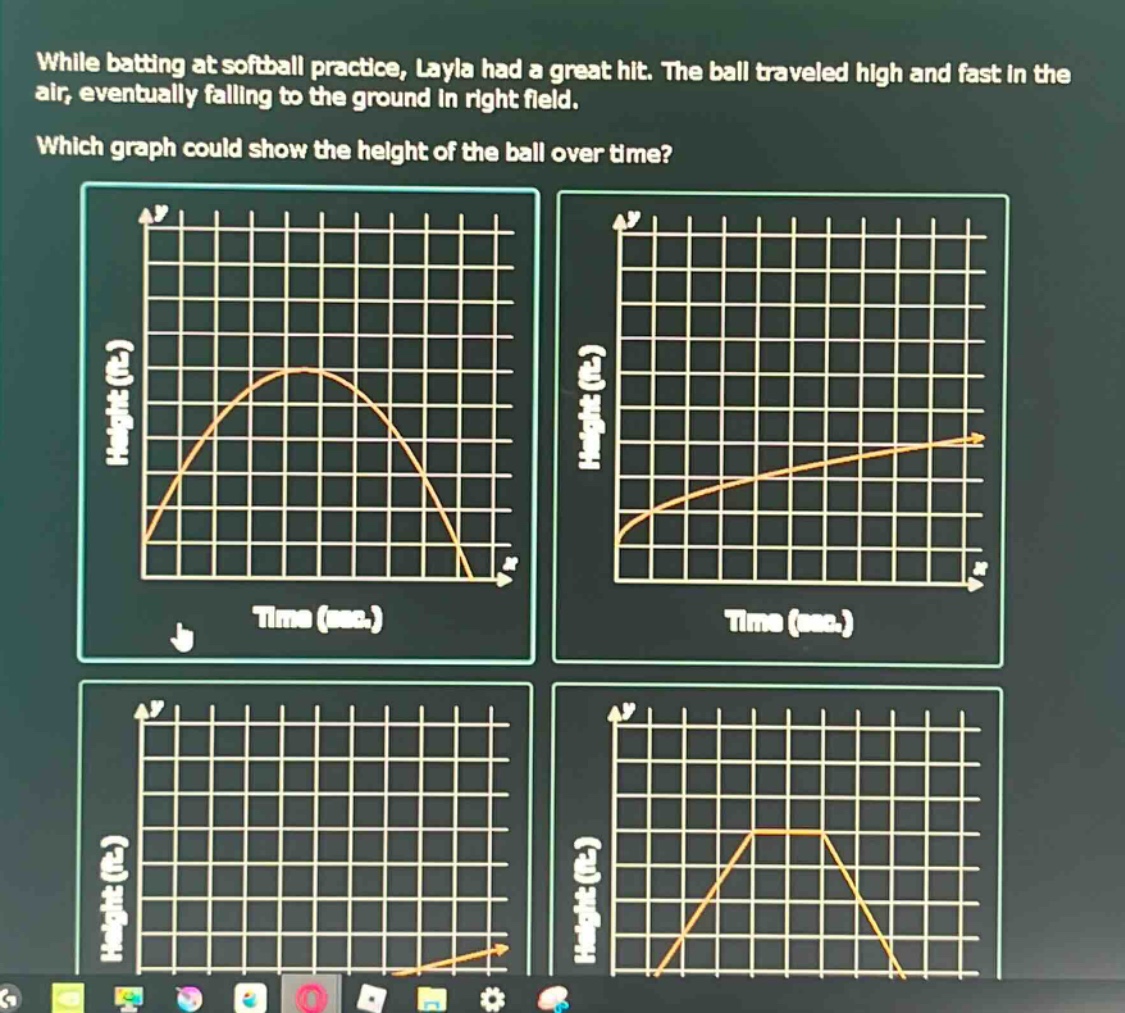
while batting at softball practice, layla had a great hit. the ball traveled high and fast in the air, eventually falling to the ground in right field. which graph could show the height of the ball over time?
Answer
Answer: The graph on the top - left
Explanation:
Step1: Analyze ball's motion
The ball starts from a certain height (bat height), goes up reaching a maximum height, then falls back to the ground.
Step2: Match with graph
The top - left graph shows an initial height, a rise to a peak, and then a fall, which matches the ball's motion. The other graphs do not represent this up - and - down motion correctly. The top - right graph shows a continuous increase, the bottom - left graph shows a non - physical linear decrease from an initial height, and the bottom - right graph shows a constant height phase which is not applicable for a freely falling ball after being hit.