the chart shows a cost-benefit analysis.\n\n| agency | # of rules | costs (billions) | benefits (billions)…
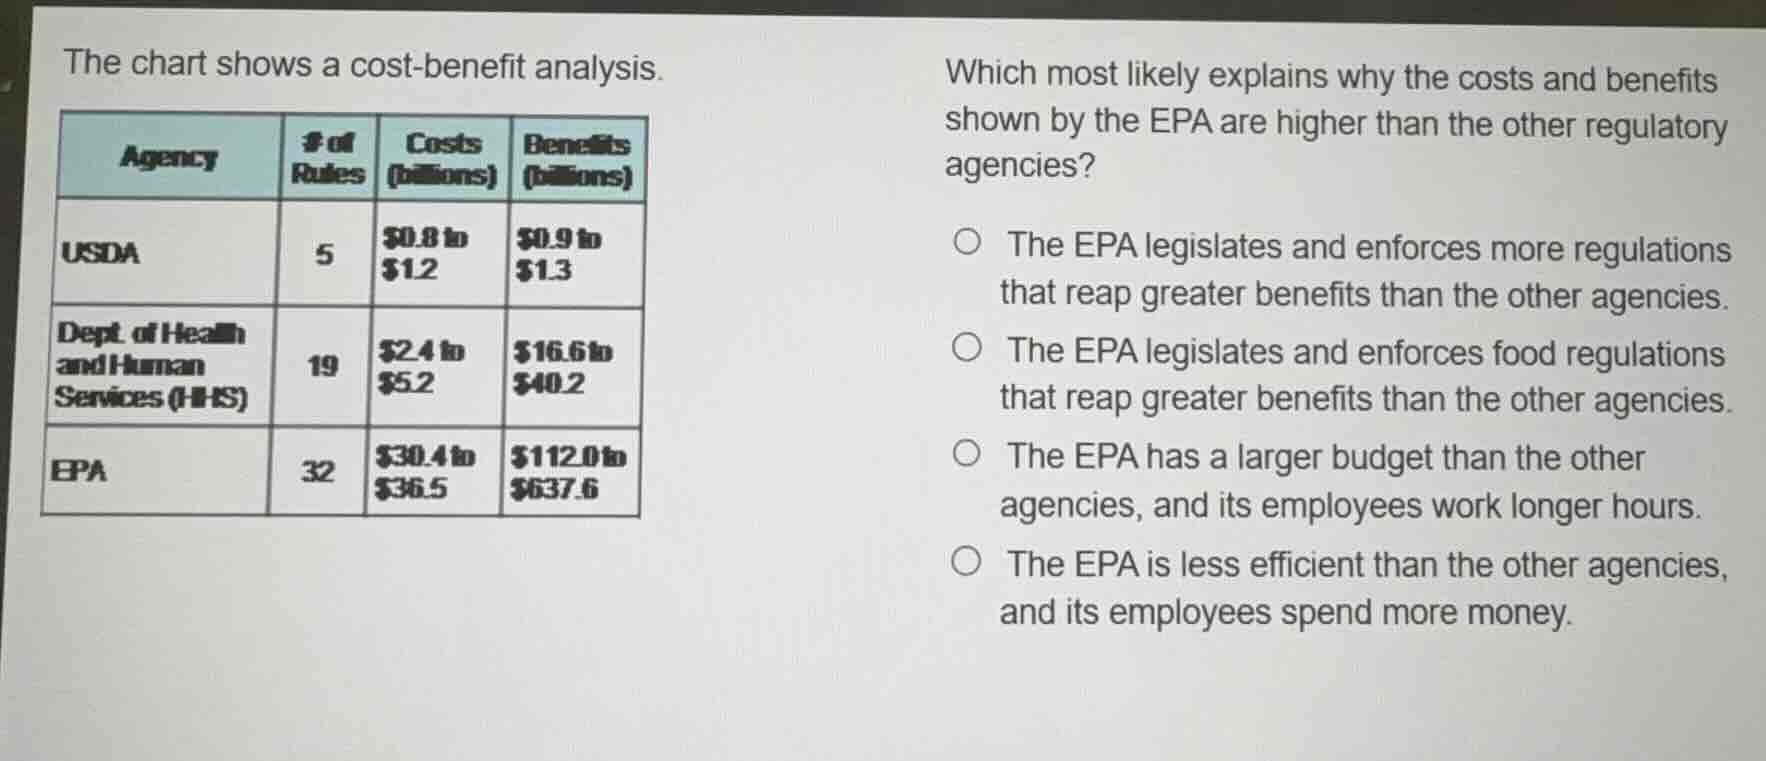
the chart shows a cost-benefit analysis.\n\n| agency | # of rules | costs (billions) | benefits (billions) |\n| :--- | :--- | :--- | :--- |\n| usda | 5 | $0.8 to $1.2 | $0.9 to $1.3 |\n| dept. of health and human services (hhs) | 19 | $2.4 to $5.2 | $16.6 to $40.2 |\n| epa | 32 | $30.4 to $36.5 | $112.0 to $637.6 |\n\nwhich most likely explains why the costs and benefits shown by the epa are higher than the other regulatory agencies?\n\n- the epa legislates and enforces more regulations that reap greater benefits than the other agencies.\n- the epa legislates and enforces food regulations that reap greater benefits than the other agencies.\n- the epa has a larger budget than the other agencies, and its employees work longer hours.\n- the epa is less efficient than the other agencies, and its employees spend more money.
Answer
Brief Explanations:
The provided chart displays a cost-benefit analysis for three different regulatory agencies: the USDA, HHS, and EPA. According to the data, the EPA has the highest number of rules (32), which correlates with significantly higher costs ($30.4 to $36.5 billion) and substantially higher benefits ($112.0 to $637.6 billion) compared to the other agencies. This indicates that the scale of the EPA's regulatory activity—legislating and enforcing a greater number of rules—is the primary driver for these higher financial figures. The other options are incorrect because the EPA does not primarily handle food regulations (that is the USDA/FDA), and the chart provides data on rules and outcomes rather than internal budgets, employee hours, or efficiency metrics.
Answer:
The EPA legislates and enforces more regulations that reap greater benefits than the other agencies.