this graph shows the adoption of computer technology in the united states. us adoption of computer…
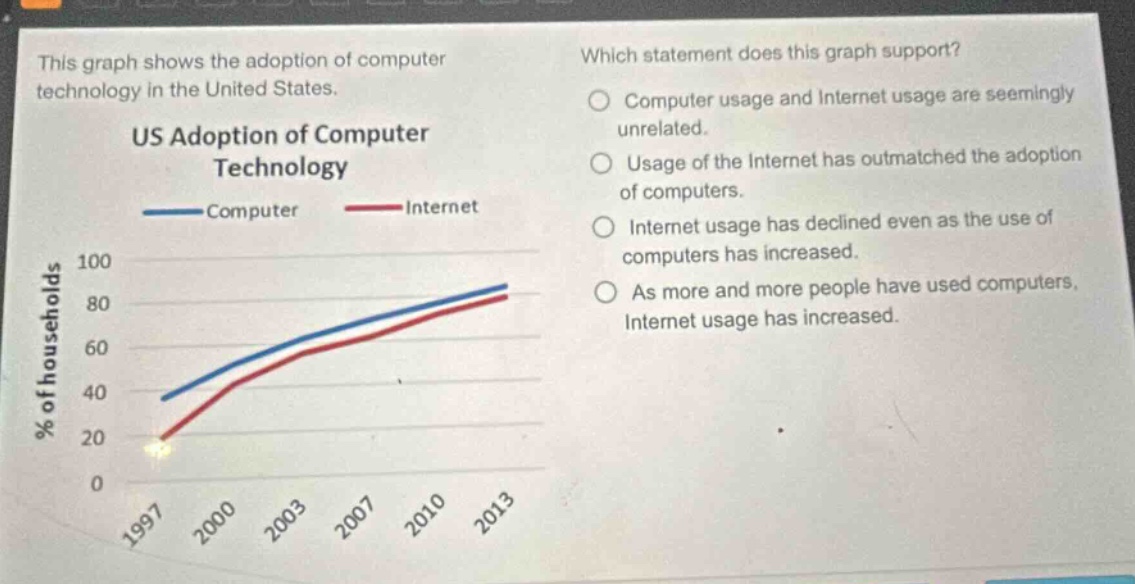
this graph shows the adoption of computer technology in the united states. us adoption of computer technology computer internet % of households 100 80 60 40 20 0 1997 2000 2003 2007 2010 2013 which statement does this graph support? computer usage and internet usage are seemingly unrelated. usage of the internet has outmatched the adoption of computers. internet usage has declined even as the use of computers has increased. as more and more people have used computers, internet usage has increased.
Answer
Brief Explanations:
By observing the graph, both the percentage of households with computers and with internet access increase over time. The trends move in a similar upward - direction, indicating a positive correlation.
Answer:
As more and more people have used computers, Internet usage has increased.