the graph shows the average life expectancy for children born in the years 1950 to 2040 for countries that…
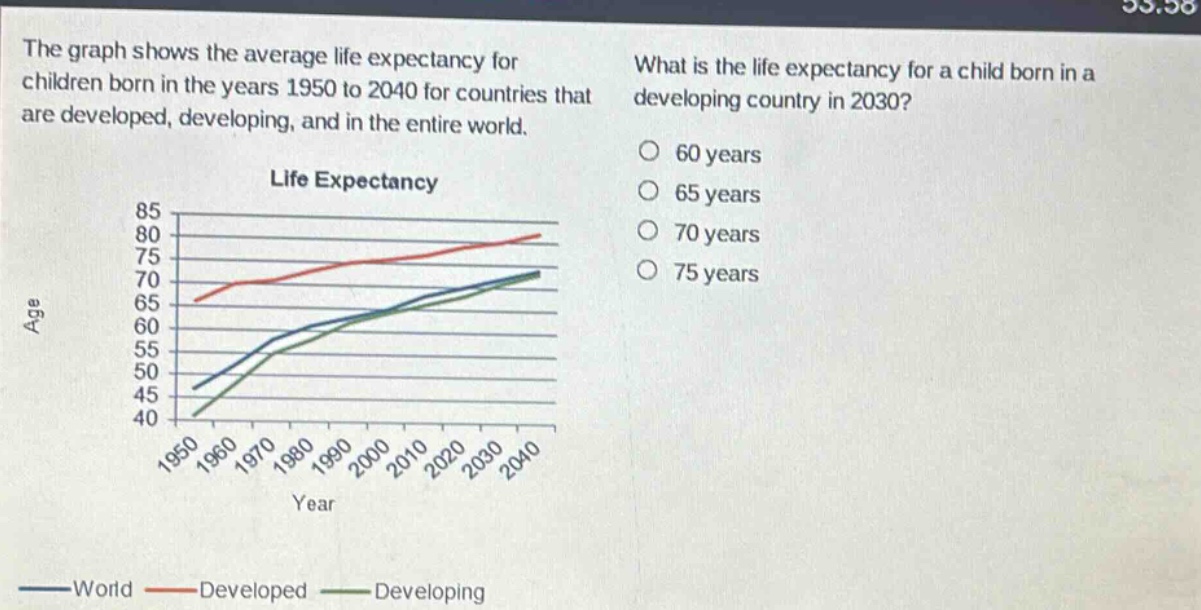
the graph shows the average life expectancy for children born in the years 1950 to 2040 for countries that are developed, developing, and in the entire world. what is the life expectancy for a child born in a developing country in 2030? 60 years 65 years 70 years 75 years life expectancy 85 80 75 70 65 60 55 50 45 40 1950 1960 1970 1980 1990 2000 2010 2020 2030 2040 year world developed developing
Answer
Explanation:
Step1: Locate the year 2030 on x - axis
Find the vertical line corresponding to 2030 on the horizontal axis labeled "Year".
Step2: Identify the curve for developing countries
Locate the green - colored curve which represents developing countries.
Step3: Read the value on y - axis
Find the point of intersection of the 2030 vertical line and the green curve, then read the corresponding value on the vertical axis labeled "Age". The value is approximately 70 years.
Answer:
70 years