the graph shows the percentage of people living in urban areas. based on the graph, what can you predict…
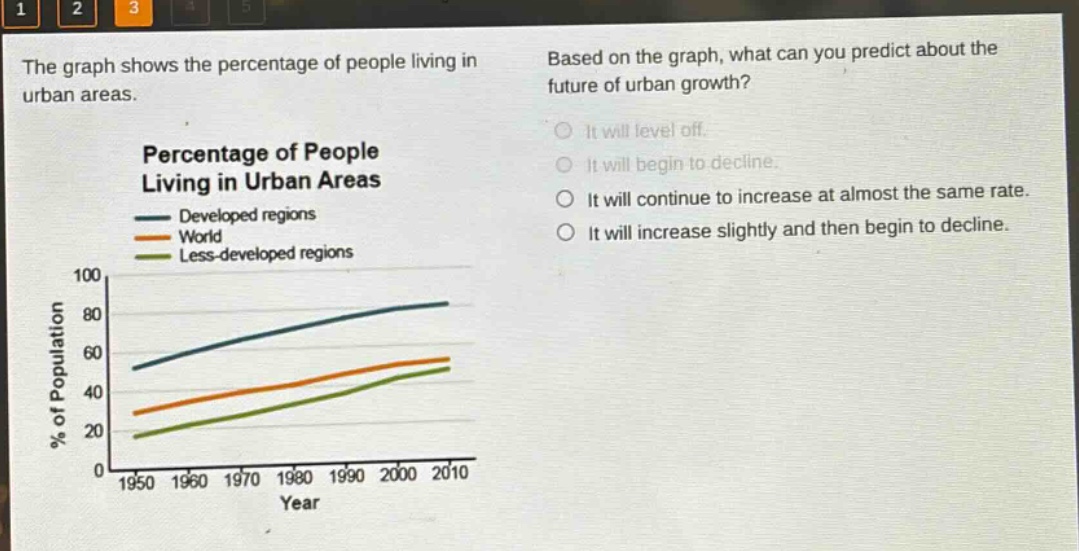
the graph shows the percentage of people living in urban areas. based on the graph, what can you predict about the future of urban growth? percentage of people living in urban areas developed regions world less - developed regions % of population 100 80 60 40 20 0 1950 1960 1970 1980 1990 2000 2010 year it will level off. it will begin to decline. it will continue to increase at almost the same rate. it will increase slightly and then begin to decline.
Answer
Brief Explanations:
Al observar la gráfica, las curvas para regiones desarrolladas, el mundo y regiones menos desarrolladas muestran un aumento constante en el porcentaje de personas viviendo en áreas urbanas a lo largo de los años. No hay indicios de declive o estabilización en el corto - mediano plazo.
Answer:
It will continue to increase at almost the same rate.