the graph shows the percentage of people living in urban areas.\npercentage of people living in urban…
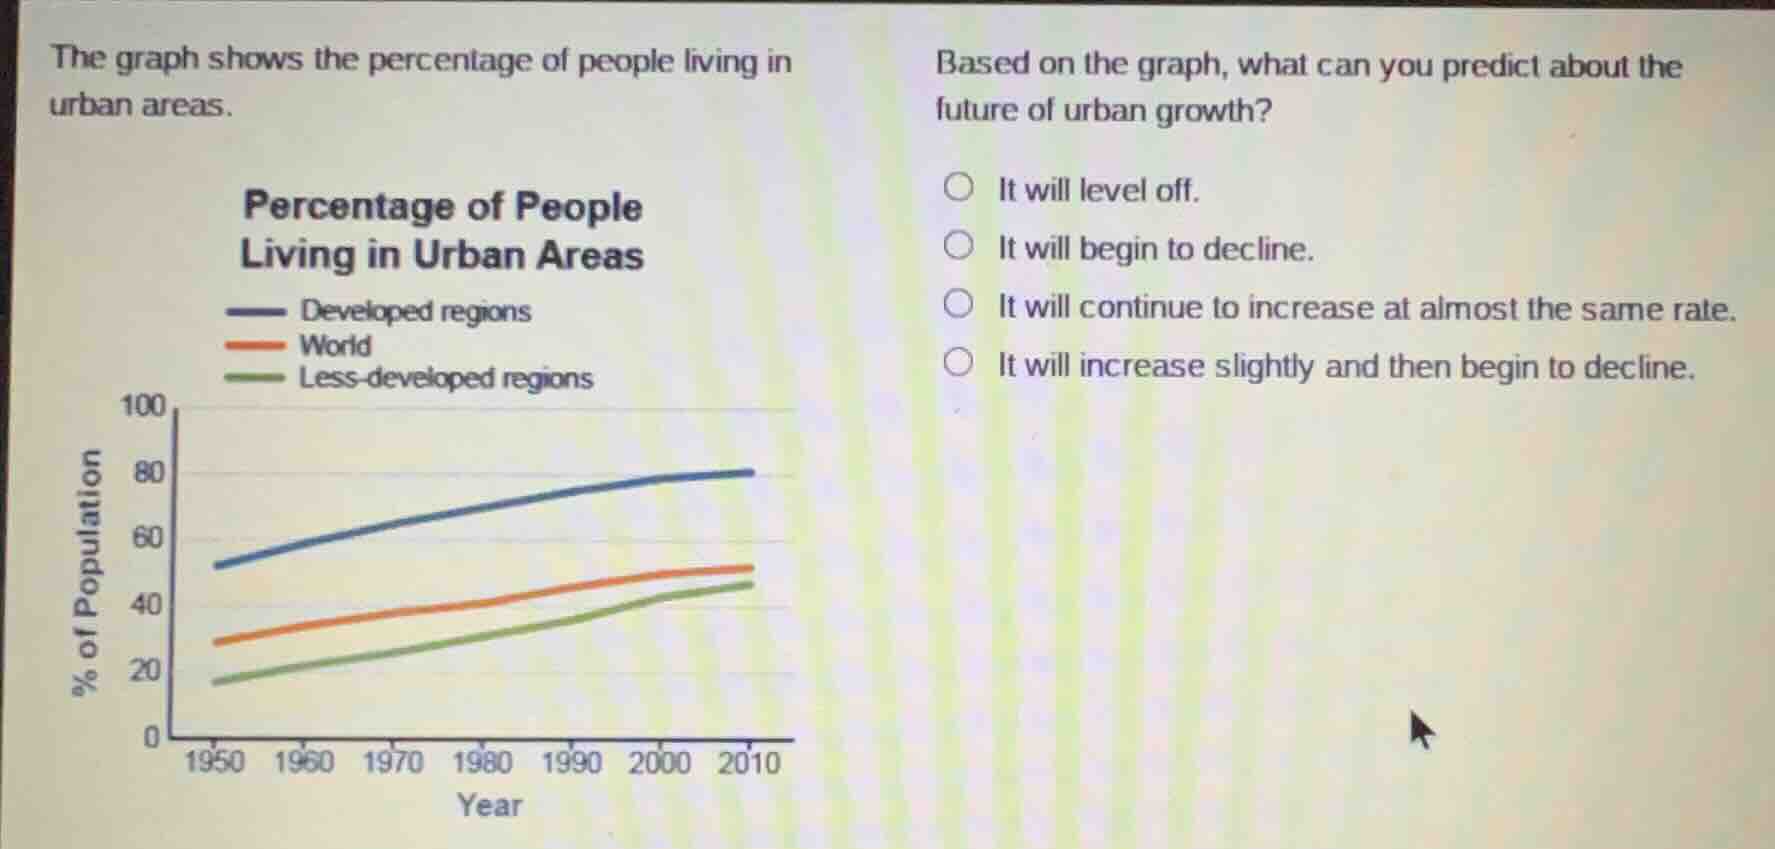
the graph shows the percentage of people living in urban areas.\npercentage of people living in urban areas\ndeveloped regions\nworld\nless-developed regions\nbased on the graph, what can you predict about the future of urban growth?\n○ it will level off.\n○ it will begin to decline.\n○ it will continue to increase at almost the same rate.\n○ it will increase slightly and then begin to decline.
Answer
Brief Explanations:
The line graph shows that from 1950 to 2010, the percentage of people in urban areas for developed regions, the world, and less-developed regions has a steady upward trend with no sign of leveling off or declining. The rate of increase remains consistent across the period.
Answer:
It will continue to increase at almost the same rate.