the graph shows the population of the united states in 2011. what portion of the population are eligible…
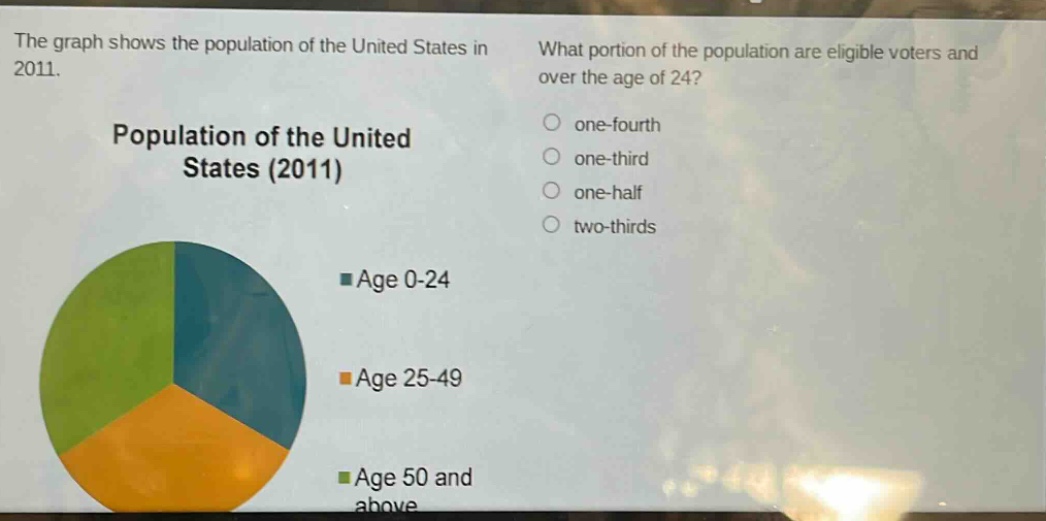
the graph shows the population of the united states in 2011. what portion of the population are eligible voters and over the age of 24? one - fourth one - third one - half two - thirds population of the united states (2011) age 0 - 24 age 25 - 49 age 50 and above
Answer
Brief Explanations:
The pie - chart shows three age - groups. The age group 0 - 24 is one - third of the circle. So the portion of the population that is 25 and above (eligible voters and over the age of 24) is two - thirds.
Answer:
two - thirds