the graph shows that sixty - eight percent of students think cyberbullying is a problem. based on the…
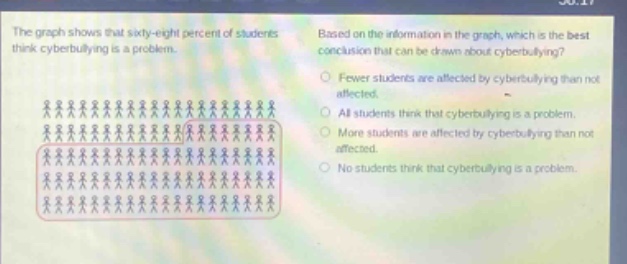
the graph shows that sixty - eight percent of students think cyberbullying is a problem. based on the information in the graph, which is the best conclusion that can be drawn about cyberbullying? fewer students are affected by cyberbullying than not affected. all students think that cyberbullying is a problem. more students are affected by cyberbullying than not affected. no students think that cyberbullying is a problem.
Answer
Answer:
A. Fewer students are affected by cyberbullying than not affected.
Brief Explanations:
Since 68% think it's a problem, less than half are directly affected as "affected" implies more than just thinking it's a problem. So fewer are affected than not.