this graph shows us government revenue and expenditures between 1980 and 2010. us government revenue and…
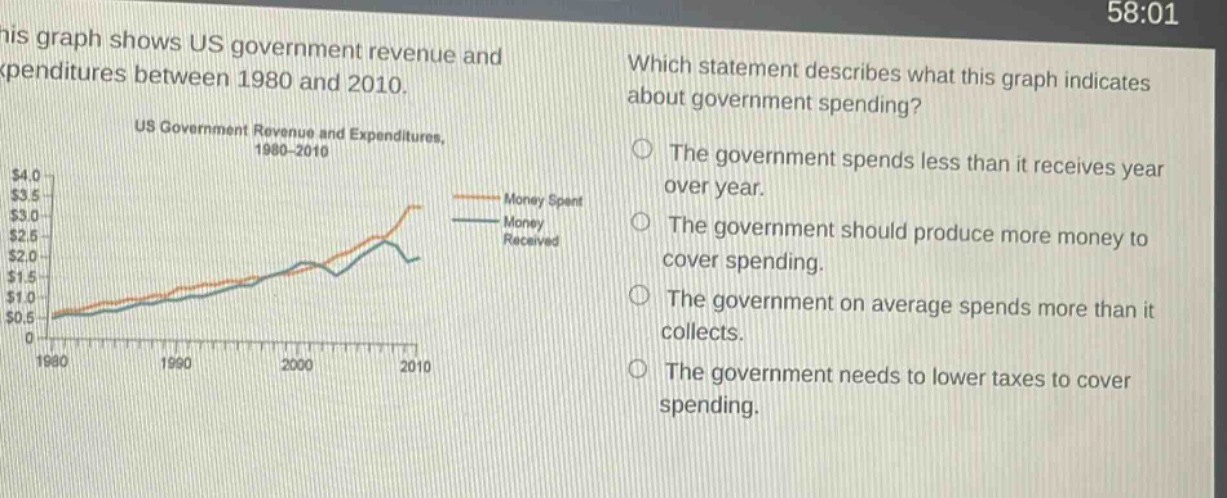
this graph shows us government revenue and expenditures between 1980 and 2010. us government revenue and expenditures, 1980 - 2010 which statement describes what this graph indicates about government spending? the government spends less than it receives year over year. the government should produce more money to cover spending. the government on average spends more than it collects. the government needs to lower taxes to cover spending.
Answer
Brief Explanations:
By observing the graph, the orange - line (money spent) is generally above the blue - line (money received) over the years from 1980 - 2010, indicating higher spending than revenue collection on average.
Answer:
The government on average spends more than it collects.