the image below shows a weather service map. which detail best describes this map? shows isolines and…
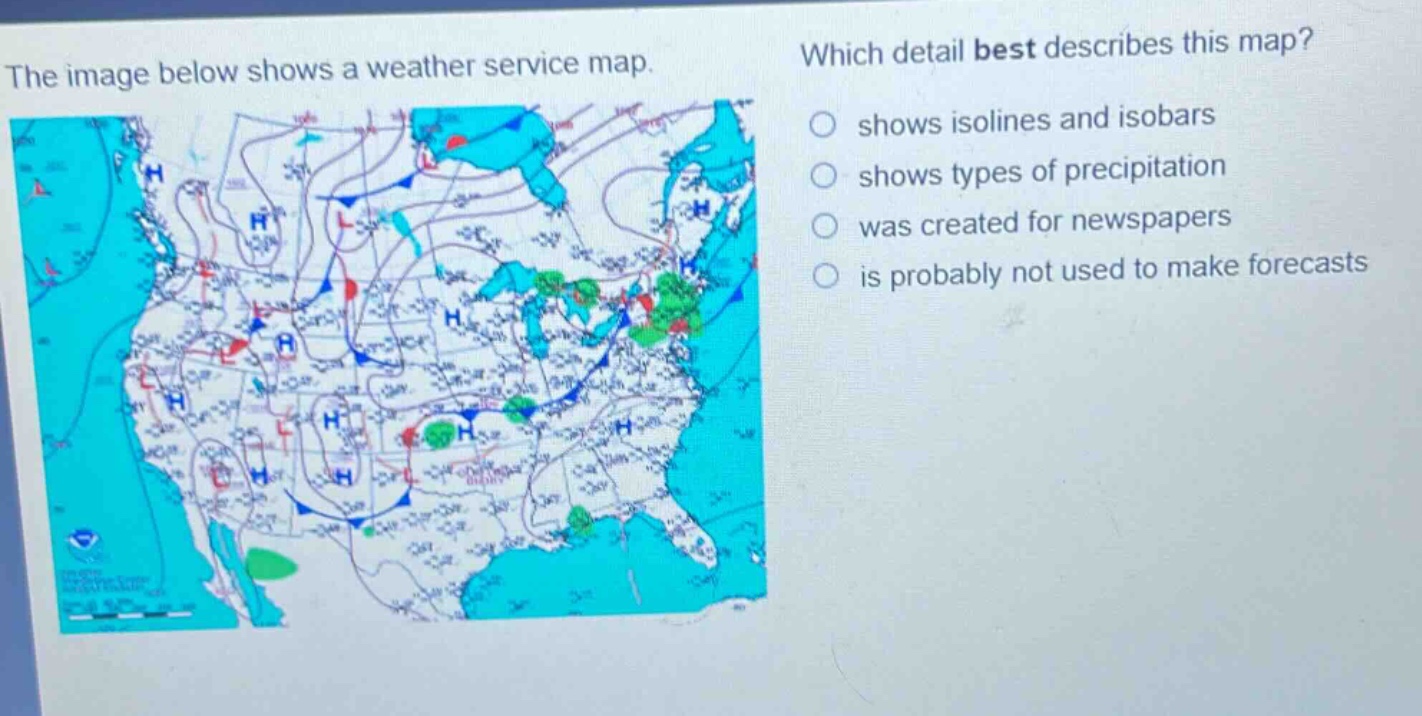
the image below shows a weather service map. which detail best describes this map? shows isolines and isobars shows types of precipitation was created for newspapers is probably not used to make forecasts
Answer
Brief Explanations:
Weather service maps often display isobars (lines of equal pressure) and other isolines. The map shows pressure - related symbols (H for high - pressure and L for low - pressure) and lines which are likely isobars. It doesn't clearly show types of precipitation, there's no indication it's for newspapers, and weather service maps are used for forecasts.
Answer:
shows isolines and isobars