look at the bar graph. which would be the best title for this graph? the race for president, 2008 voter…
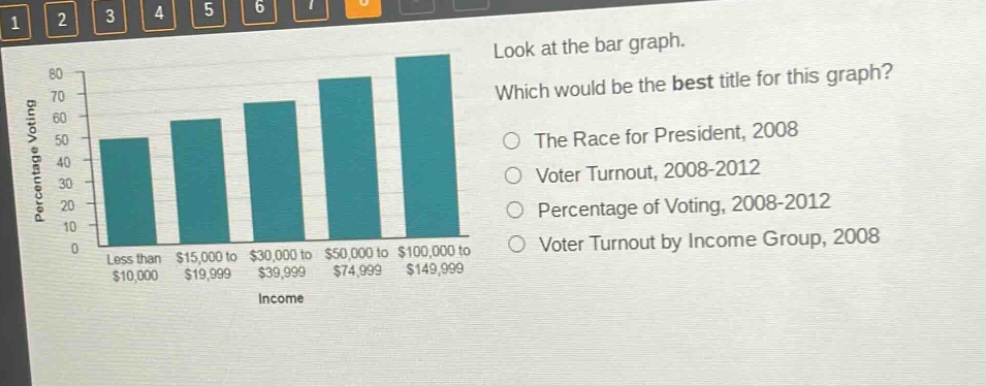
look at the bar graph. which would be the best title for this graph? the race for president, 2008 voter turnout, 2008 - 2012 percentage of voting, 2008 - 2012 voter turnout by income group, 2008
Answer
Brief Explanations:
The bar - graph shows the percentage of voting for different income groups in 2008. The other options either don't mention income groups or have incorrect time - frames.
Answer:
Voter Turnout by Income Group, 2008