look at the bar graph. nontraditional voting in 2020 by demographic characteristics age 18 - 29 65.4 30 - 44…
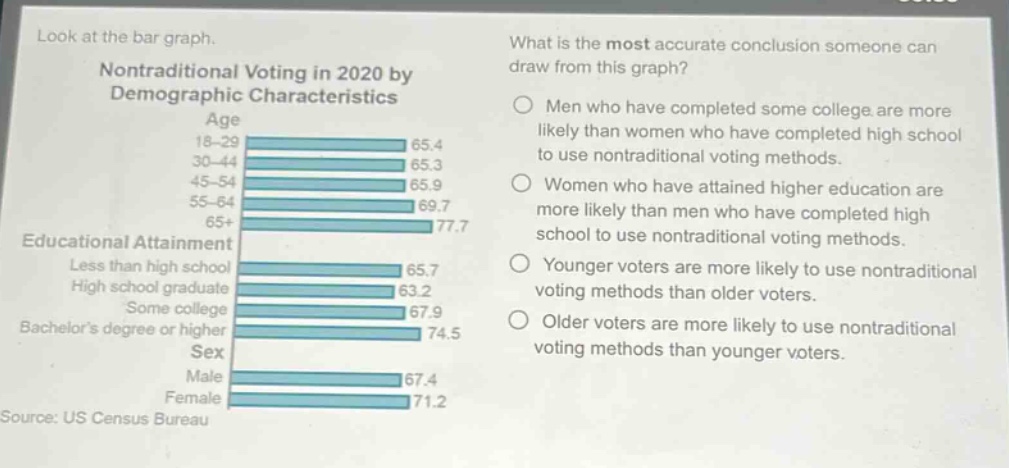
look at the bar graph. nontraditional voting in 2020 by demographic characteristics age 18 - 29 65.4 30 - 44 65.3 45 - 54 65.9 55 - 64 69.7 65+ 77.7 educational attainment less than high school 65.7 high school graduate 63.2 some college 67.9 bachelors degree or higher 74.5 sex male 67.4 female 71.2 source: us census bureau what is the most accurate conclusion someone can draw from this graph? men who have completed some college are more likely than women who have completed high school to use nontraditional voting methods. women who have attained higher education are more likely than men who have completed high school to use nontraditional voting methods. younger voters are more likely to use nontraditional voting methods than older voters. older voters are more likely to use nontraditional voting methods than younger voters.
Answer
Brief Explanations:
Analyze the bar - graph data. For age, as age increases from 18 - 29 (65.4) to 65+ (77.7), the percentage of non - traditional voting increases. For educational attainment and sex, no clear such consistent trends are seen in the given comparisons.
Answer:
Older voters are more likely to use nontraditional voting methods than younger voters.