look at the line graph below, showing world grain production from 1950 to 2010. which of the following…
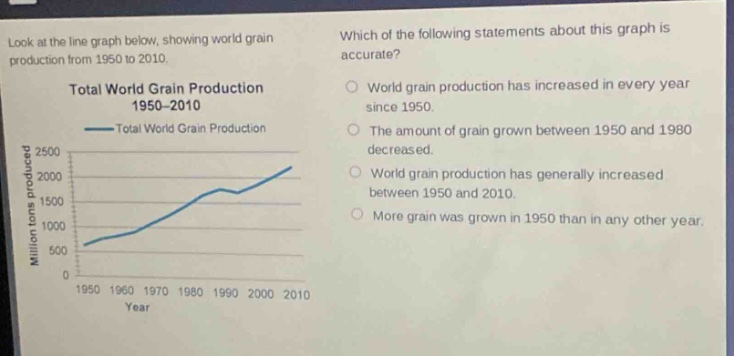
look at the line graph below, showing world grain production from 1950 to 2010. which of the following statements about this graph is accurate? total world grain production 1950 - 2010 total world grain production million tons produced 2500 2000 1500 1000 500 0 1950 1960 1970 1980 1990 2000 2010 year world grain production has increased in every year since 1950. the amount of grain grown between 1950 and 1980 decreased. world grain production has generally increased between 1950 and 2010. more grain was grown in 1950 than in any other year.
Answer
Answer:
World grain production has generally increased between 1950 and 2010.
Explanation:
Step1: Analyze first option
The graph shows fluctuations, not continuous increase each year.
Step2: Analyze second option
The graph shows an overall upward - trend from 1950 to 1980, not decrease.
Step3: Analyze third option
The line graph shows an upward - sloping trend from 1950 to 2010, indicating a general increase.
Step4: Analyze fourth option
1950 has one of the lowest production values on the graph.