look at the table. what information is missing from the table that could help someone draw the most accurate…
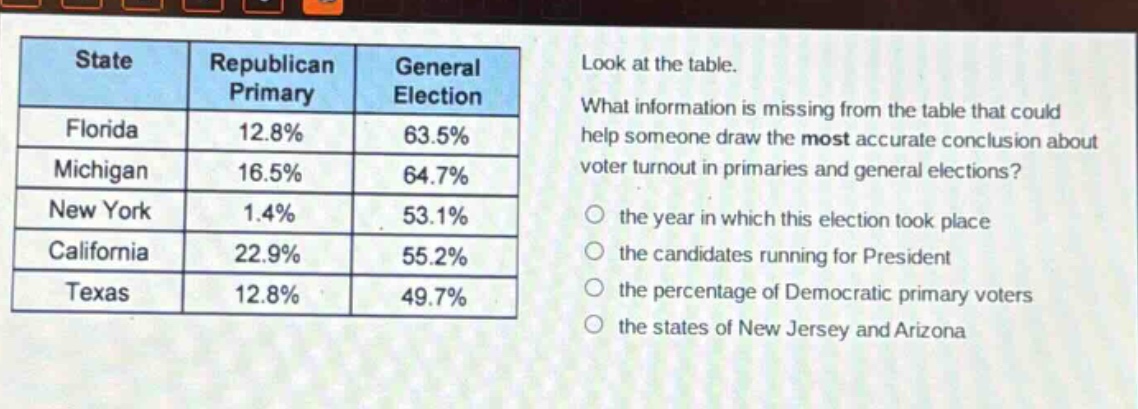
look at the table. what information is missing from the table that could help someone draw the most accurate conclusion about voter turnout in primaries and general elections? the year in which this election took place the candidates running for president the percentage of democratic primary voters the states of new jersey and arizona\nstate republican primary general election\nflorida 12.8% 63.5%\nmichigan 16.5% 64.7%\nnew york 1.4% 53.1%\ncalifornia 22.9% 55.2%\ntexas 12.8% 49.7%
Answer
Answer:
C. the percentage of Democratic primary voters
Brief Explanations:
The table only includes Republican primary data. To analyze voter turnout in primaries (which include both major parties), Democratic primary percentages are necessary for a complete comparison with general election data.