look at the table. the table represents the voter turnout rates for republican primary and general…
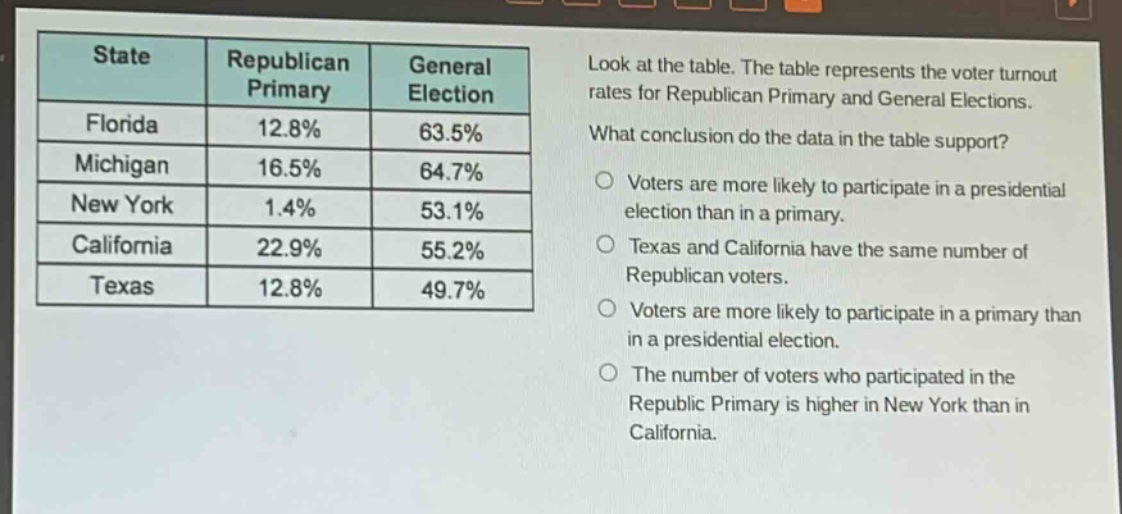
look at the table. the table represents the voter turnout rates for republican primary and general elections. what conclusion do the data in the table support? voters are more likely to participate in a presidential election than in a primary. texas and california have the same number of republican voters. voters are more likely to participate in a primary than in a presidential election. the number of voters who participated in the republic primary is higher in new york than in california.\nstate\trepublican primary\tgeneral election\nflorida\t12.8%\t63.5%\nmichigan\t16.5%\t64.7%\nnew york\t1.4%\t53.1%\ncalifornia\t22.9%\t55.2%\ntexas\t12.8%\t49.7%
Answer
Answer:
Voters are more likely to participate in a presidential election than in a primary.
Brief Explanations:
The table shows higher turnout rates for general (presidential) elections compared to Republican primaries across states.