what does each point (x, y) represent?\n the number of students that year\n the years since 2000\n the…
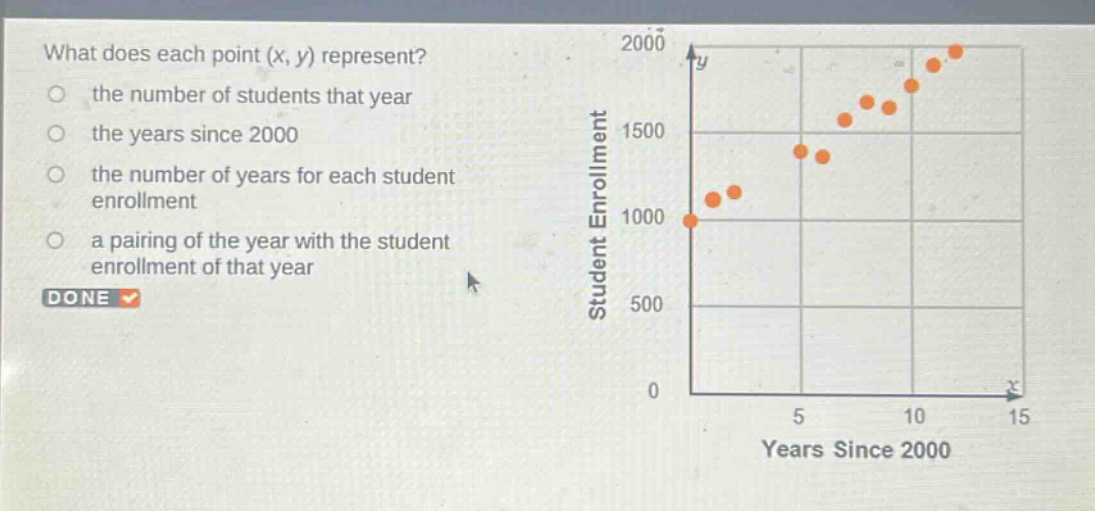
what does each point (x, y) represent?\n the number of students that year\n the years since 2000\n the number of years for each student enrollment\n a pairing of the year with the student enrollment of that year\n done
Answer
Brief Explanations:
The x - axis represents years since 2000 and y - axis represents student enrollment. Each (x, y) point on the graph shows the student enrollment for a particular year (number of years since 2000).
Answer:
a pairing of the year with the student enrollment of that year