social studies test - u.s. history\nquestions 1 and 2 refer to the line graphs showing changes in the number…
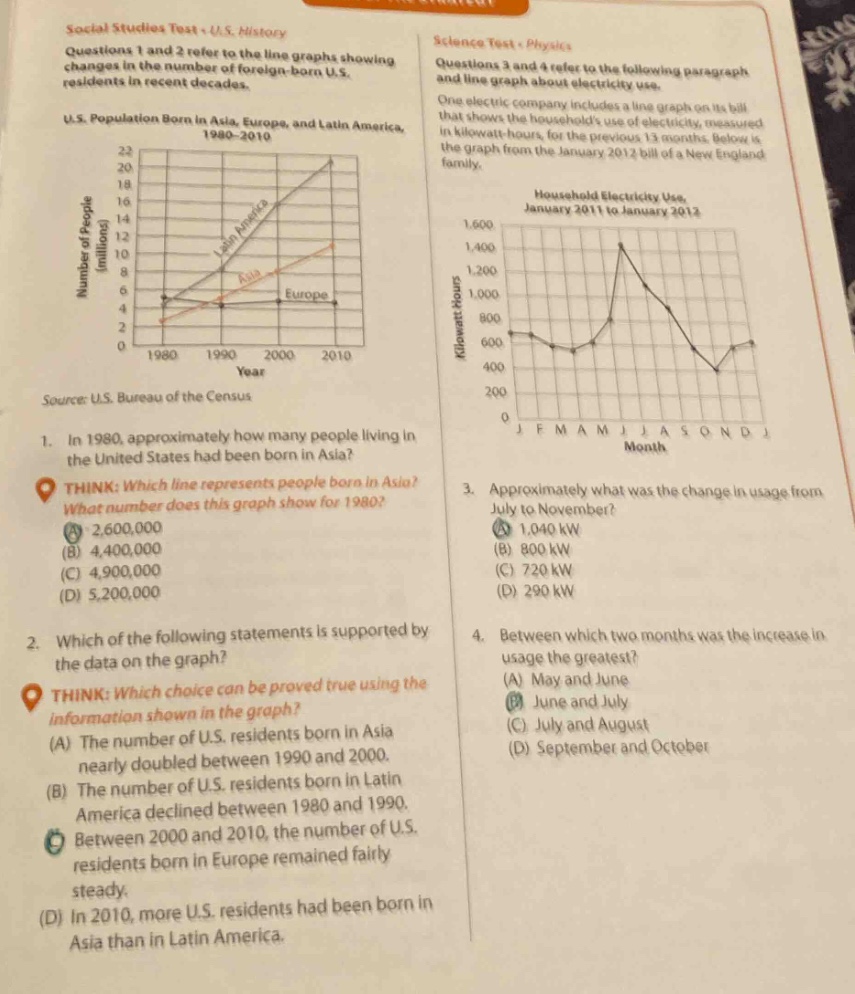
social studies test - u.s. history\nquestions 1 and 2 refer to the line graphs showing changes in the number of foreign - born u.s. residents in recent decades.\nu.s. population born in asia, europe, and latin america, 1980 - 2010\nsource: u.s. bureau of the census\n1. in 1980, approximately how many people living in the united states had been born in asia?\nthink: which line represents people born in asia? what number does this graph show for 1980?\n(a) 2,600,000\n(b) 4,400,000\n(c) 4,900,000\n(d) 5,200,000\n2. which of the following statements is supported by the data on the graph?\nthink: which choice can be proved true using the information shown in the graph?\n(a) the number of u.s. residents born in asia nearly doubled between 1990 and 2000.\n(b) the number of u.s. residents born in latin america declined between 1980 and 1990.\n(c) between 2000 and 2010, the number of u.s. residents born in europe remained fairly steady.\n(d) in 2010, more u.s. residents had been born in asia than in latin america.\nscience test - physics\nquestions 3 and 4 refer to the following paragraph and line graph about electricity use.\none electric company includes a line graph on its bill that shows the households use of electricity, measured in kilowatt - hours, for the previous 13 months. below is the graph from the january 2012 bill of a new england family.\nhousehold electricity use, january 2011 to january 2012\n3. approximately what was the change in usage from july to november?\n(a) 1,040 kw\n(b) 800 kw\n(c) 720 kw\n(d) 290 kw\n4. between which two months was the increase in usage the greatest?\n(a) may and june\n(b) june and july\n(c) july and august\n(d) september and october
Answer
Explanation:
Step1: Analyze question 1
Locate the line for Asia in the U.S. - Population Born in Asia, Europe, and Latin America 1980 - 2010 graph and find the value for 1980. The value is around 4.4 million or 4,400,000.
Step2: Analyze question 2
- Option A: The number of U.S. residents born in Asia did not nearly double between 1990 and 2000.
- Option B: The number of U.S. residents born in Latin - America increased between 1980 and 1990.
- Option C: Between 2000 and 2010, the line for Europe is relatively flat, indicating the number of U.S. residents born in Europe remained fairly steady.
- Option D: In 2010, more U.S. residents had been born in Latin America than in Asia.
Step3: Analyze question 3
In the Household Electricity Use graph, the usage in July is about 1400 kWh and in November is about 400 kWh. The change is (1400 - 400=1000) kWh, closest to 1040 kWh.
Step4: Analyze question 4
Calculate the differences in usage between consecutive months:
- May - June: Small increase.
- June - July: Large increase.
- July - August: Decrease.
- September - October: Small increase.
Answer:
- B. 4,400,000
- C. Between 2000 and 2010, the number of U.S. residents born in Europe remained fairly steady.
- A. 1,040 kW
- B. June and July