a study investigated the job satisfaction of teachers allowed to choose supplementary curriculum for their…
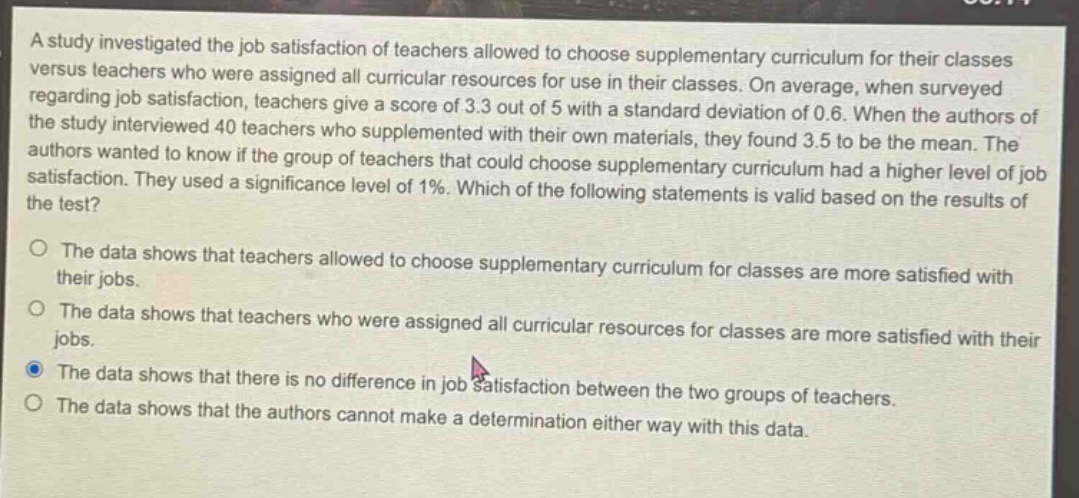
a study investigated the job satisfaction of teachers allowed to choose supplementary curriculum for their classes versus teachers who were assigned all curricular resources for use in their classes. on average, when surveyed regarding job satisfaction, teachers give a score of 3.3 out of 5 with a standard deviation of 0.6. when the authors of the study interviewed 40 teachers who supplemented with their own materials, they found 3.5 to be the mean. the authors wanted to know if the group of teachers that could choose supplementary curriculum had a higher level of job satisfaction. they used a significance level of 1%. which of the following statements is valid based on the results of the test?\n\nthe data shows that teachers allowed to choose supplementary curriculum for classes are more satisfied with their jobs.\n\nthe data shows that teachers who were assigned all curricular resources for classes are more satisfied with their jobs.\n\nthe data shows that there is no difference in job satisfaction between the two groups of teachers.\n\nthe data shows that the authors cannot make a determination either way with this data.
Answer
Explanation:
Step1: Identify the hypothesis
We want to test if teachers who can choose supplementary curriculum have higher job - satisfaction. Let $\mu_1$ be the mean job - satisfaction of teachers who choose supplementary curriculum and $\mu_2$ be the mean job - satisfaction of teachers who are assigned all curriculum resources. The null hypothesis $H_0:\mu_1\leq\mu_2$ and the alternative hypothesis $H_1:\mu_1 > \mu_2$.
Step2: Calculate the test statistic (assuming a two - sample t - test, but we don't have all data for full calculation). However, we can consider the concept of significance level. The significance level is $\alpha = 0.01$. If the p - value of the test is greater than $\alpha$, we fail to reject the null hypothesis. Without full data for calculation, we note that just comparing the sample means ($\bar{x}_1 = 3.5$ for teachers who choose supplementary curriculum and $\bar{x}_2=3.3$ for teachers who are assigned resources) is not enough. We need to consider the variability (standard deviation) and sample size in a proper statistical test. Since we are not given enough information to perform a full hypothesis test (such as the standard deviation of the second group, and the nature of the populations), we cannot make a valid determination.
Answer:
The data shows that the authors cannot make a determination either way with this data.